数据可视化基础知识
Why use data vis
When you need to work with a new data source, with a huge amount of data, it can be important to use data visualization to understand the data better.
The data analysis process is most of the times done in 5 steps:
- Extract - Obtain the data from a spreadsheet, SQL, the web, etc.
- Clean - Here we could use exploratory visuals.
- Explore - Here we use exploratory visuals.
- Analyze - Here we might use either exploratory or explanatory visuals.
- Share - Here is where explanatory visuals live.
Types of data
To be able to choose an appropriate plot for a given measure, it is important to know what data you are dealing with.
Qualitative aka categorical types
Nominal qualitative data
Labels with no order or rank associated with the items itself.
Examples: Gender, marital status, menu items
Ordinal qualitative data
Labels that have an order or ranking.
Examples: letter grades, rating
Quantitative aka numeric types
Discrete quantitative values
Numbers can not be split into smaller units
Examples: Pages in a Book, number of trees in a park
Continuous quantitative values
Numbers can be split in smaller units
Examples: Height, Age, Income, Workhours
Summary Statistics
Numerical Data
Mean: The average value.
Median: The middle value when the data is sorted.
Mode: The most frequently occurring value.
Variance/Standard Deviation: Measures of spread or dispersion.
Range: Difference between the maximum and minimum values.
Categorical Data
Frequency: The count of occurrences of each category.
Mode: The most frequent category.
Visualizations
You can get insights to a new data source very quick and also see connections between different datatypes easier.
Because when you only use the standard statistics to summarize your data, you will get the min, max, mean, median and mode, but this might be misleading in other aspects. Like it is shown in Anscombe's Quartet: the mean and deviation are always the same, but the data distribution is always different.
In data visualization, we have two types:
- Exploratory data visualization We use this to get insights about the data. It does not need to be visually appealing.
- Explanatory data visualization This visualizations need to be accurate, insightful and visually appealing as this is presented to the users.
Chart Junk, Data Ink Ratio and Design Integrity
Chart Junk
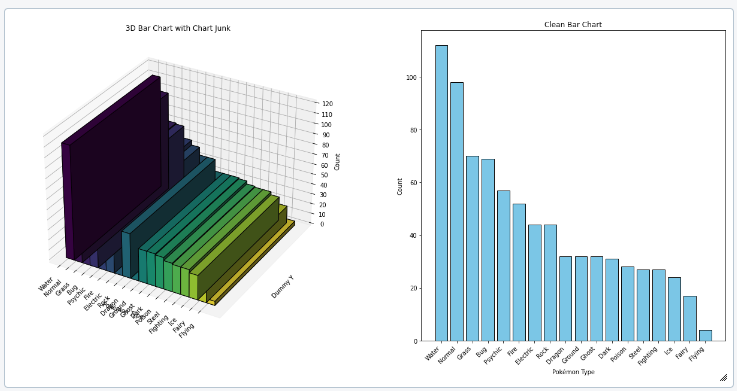
To be able to read the information provided via plot without distraction, it is important to avoid chart junk. Like:
- Heavy grid lines
- Pictures in the visuals
- Shades
- 3d components
- Ornaments
- Superfluous texts
Data Ink Ratio
The lower your chart junk in a visual is the higher the data ink ratio is. This just means the more "ink" in the visual is used to transport the message of the data, the better it is.
Design Integrity
The Lie Factor is calculated as:
$$
\text{Lie Factor} = \frac{\text{Size of effect shown in graphic}}{\text{Size of effect in data}}
$$
The delta stands for the difference. So it is the relative change shown in the graphic divided by the actual relative change in the data. Ideally it should be 1. If it is not, it means that there is some missmatch in the way the data is presented and the actual change.

In the example above, taken from the wiki, the lie factor is 3, when comparing the pixels of each doctor, representing the numbers of doctors in California.
Tidy data
make sure you're data is cleaned properly and ready to use:
- each variable is a column
- each observation is a row
- each type of observational unit is a table
Univariate Exploration of Data
This refers to the analysis of a single variable (or feature) in a dataset.
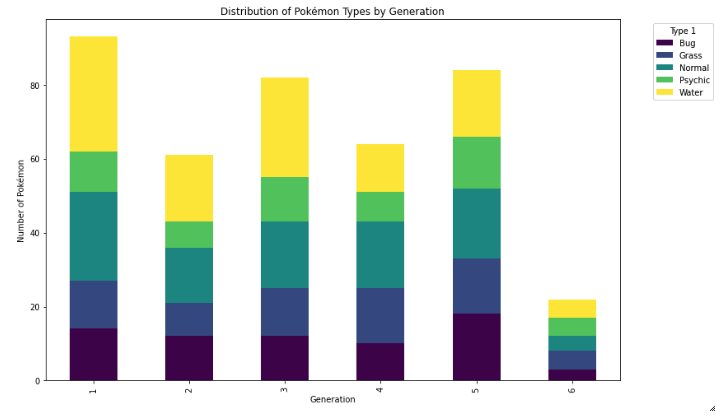
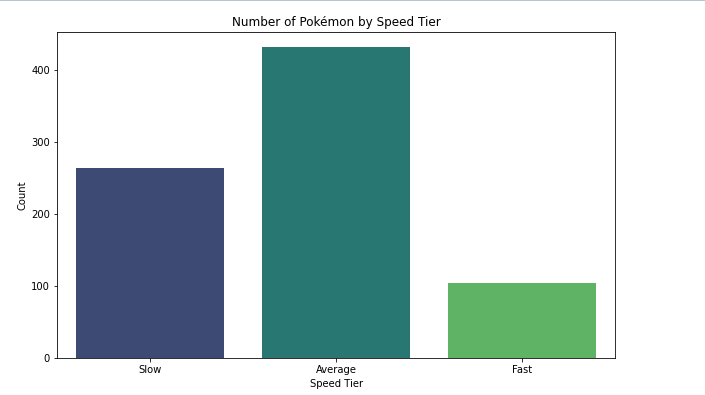
Bar Chart
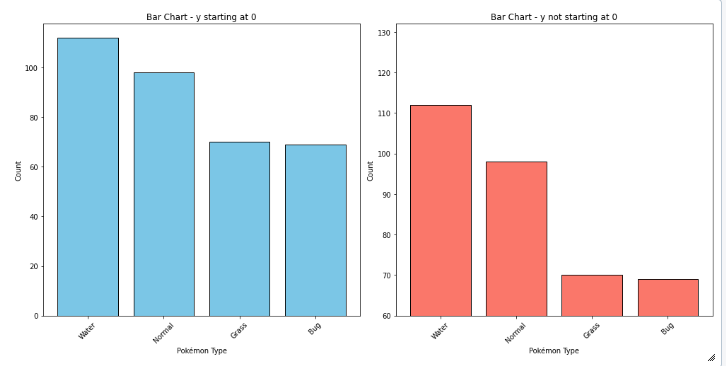
- always plot starting with 0 to present values in real comparable way.
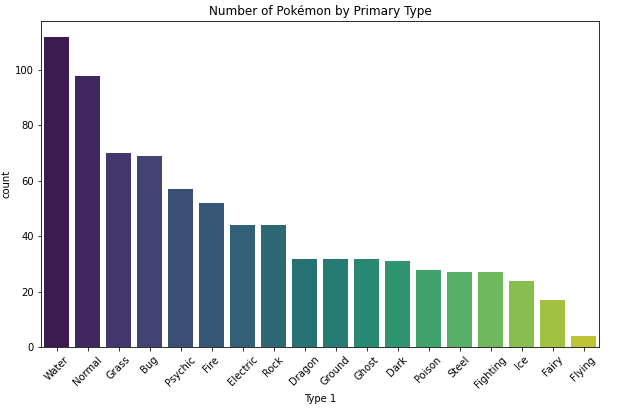
- sort nominal data
- don't sort ordinal data - here it is more important to know how often the most important category appears than the most frequent
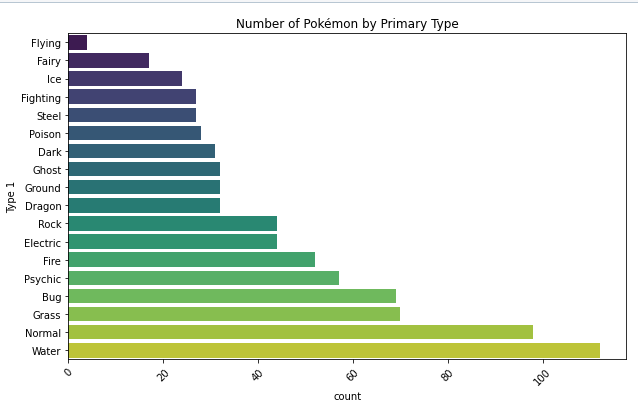
- if you have a lot of categories use a horizontal bar chart: having the categories on the y-axes, to make it better readable.
Histogram
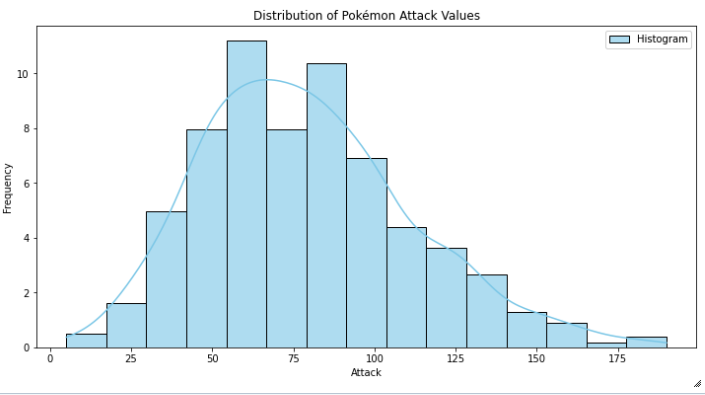
- quantitative version of a bar chart. This is used to plot numeric values.
- values are grouped into continous bins, one bar for each is plotted
KDE - Kernel Density Estimation
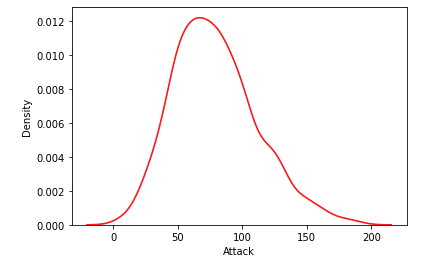
- often a Gaussian or normal distribution, to estimate the density at each point.
- KDE plots can reveal trends and the shape of the distribution more clearly, especially for data that is not uniformly distributed.
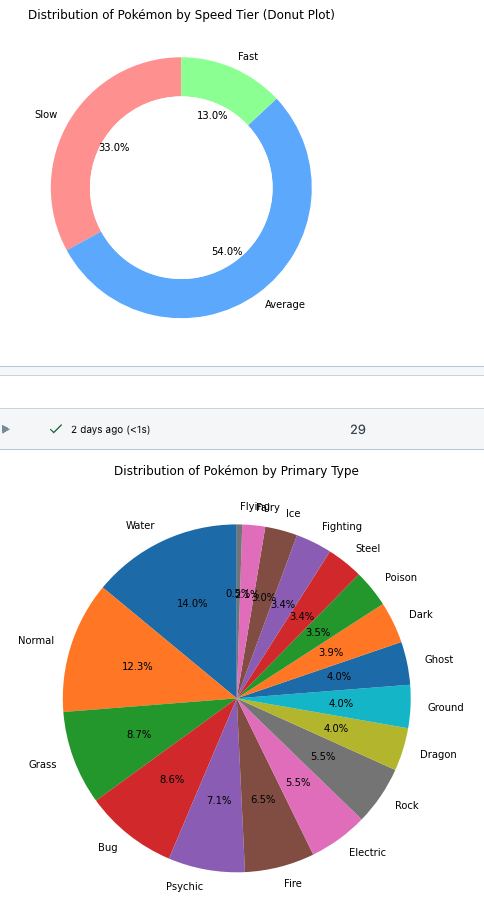
Pie Chart and Donut Plot
- data needs to be in relative frequencies
- pie charts work best with 3 slices at maximum. If there are more wedges to display it gets unreadable and the different amounts are hard to compare. Then you would prefer a bar chart.
BiVariate Exploration of Data
Analyzes the relationship between two variables in a dataset.
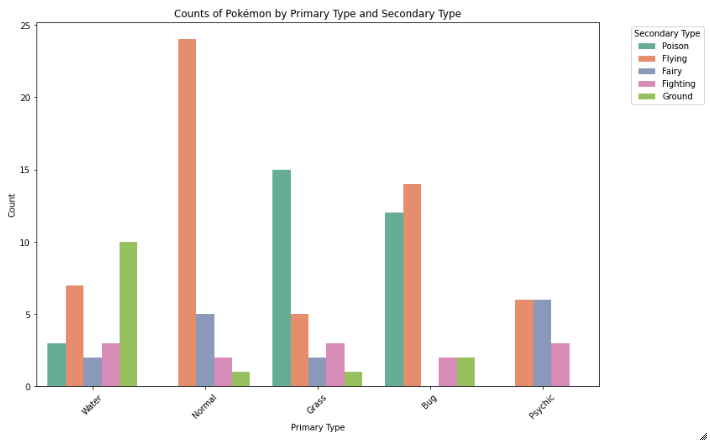
Clustered Bar Charts
- displays the relationship between two categorical values. The bars are organized in clusters based on the level of the first variable.
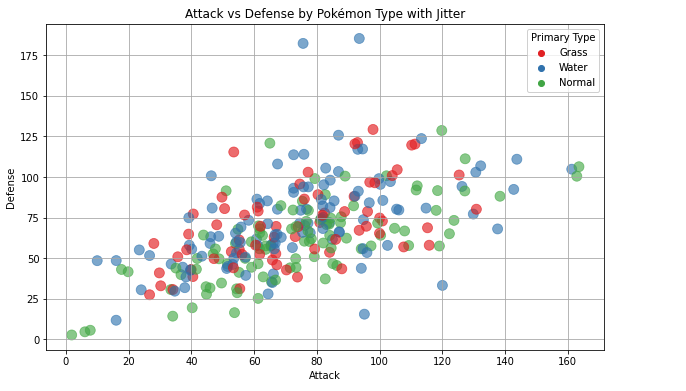
Scatterplots
- each data point is plotted individually as a point, its x-position corresponding to one feature value and its y-position corresponding to the second.
- if the plot suffers from overplotting (too many datapoints overlap): you can use transparency and jitter (every point is moved slightly from its true value)
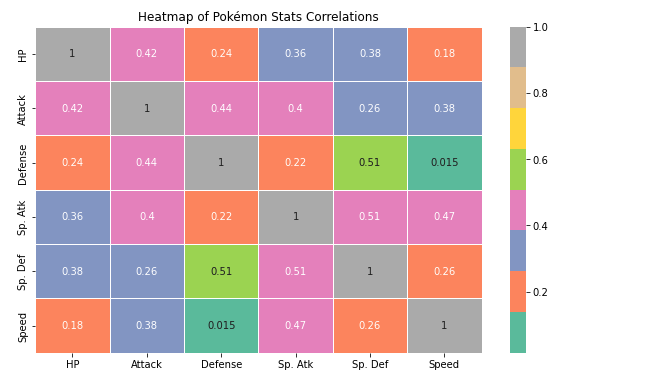
Heatmaps
- 2d version of a Histogram
- data points are placed with its x-position corresponding to one feature value and its y-position corresponding to the second.
- the plotting area is divided into a grid, and the numbers of points add up there and the counts are indicated by color
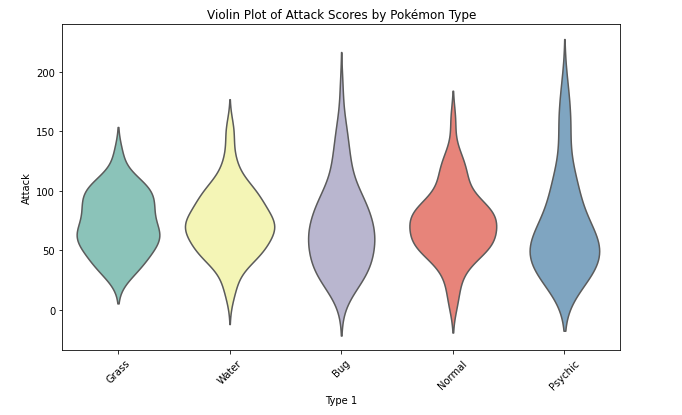
Violin plots
- show the relationship between quantitative (numerical) and qualitative (categorical) variables on a lower level of absraction.
- the distribution is plotted like a kernel density estimate, so we can have a clear
- to display the key statistics at the same time, you can embedd a box plot in a violin plot.
Box plots
- it also plots the relationship between quantitative (numerical) and qualitative (categorical) variables on a lower level of absraction.
- compared to the violin plot, the box plot leans more on the summarization of the data, primarily just reporting a set of descriptive statistics for the numeric values on each categorical level.
- it visualizes the five-number summary of the data: minimum, first quartile (Q1), median (Q2), third quartile (Q3), and maximum.
Key elements of a boxplot:
Box: The central part of the plot represents the interquartile range (IQR), which is the range between the first quartile (Q1, 25th percentile) and the third quartile (Q3, 75th percentile). This contains the middle 50% of the data.
Median Line: Inside the box, a line represents the median (Q2, 50th percentile) of the dataset.
Whiskers: Lines extending from the box, known as "whiskers," show the range of the data that lies within 1.5 times the IQR from Q1 and Q3. They typically extend to the smallest and largest values within this range.
Outliers: Any data points that fall outside 1.5 times the IQR are considered outliers and are often represented by individual dots or marks beyond the whiskers.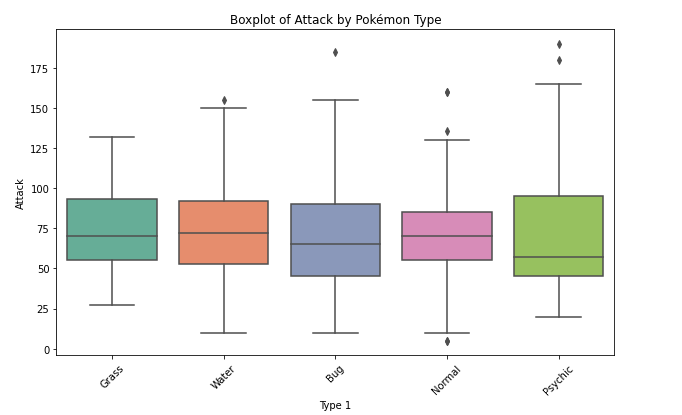
Combined Violin and Box Plot
The violin plot shows the density across different categories, and the boxplot provides the summary statistics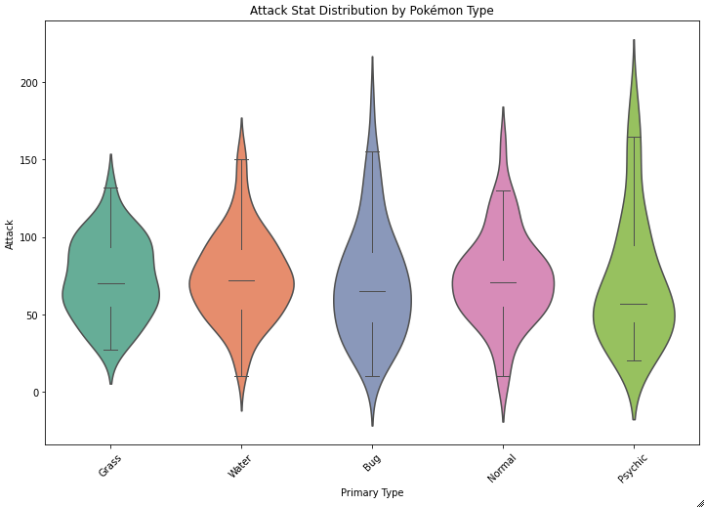
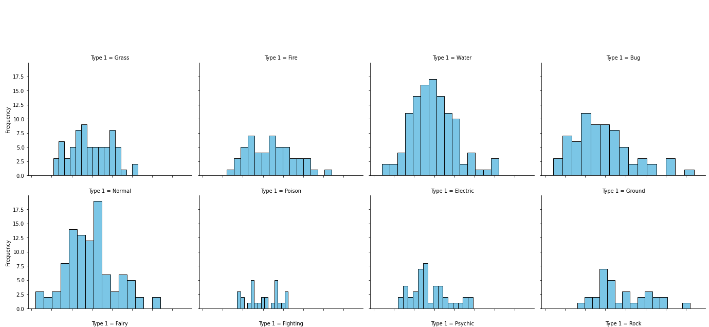
Faceting
- the data is divided into disjoint subsets, most often by different levels of a categorical variable. For each of these subsets of the data, the same plot type is rendered on other variables, ie more histograms next to each other with different categorical values.
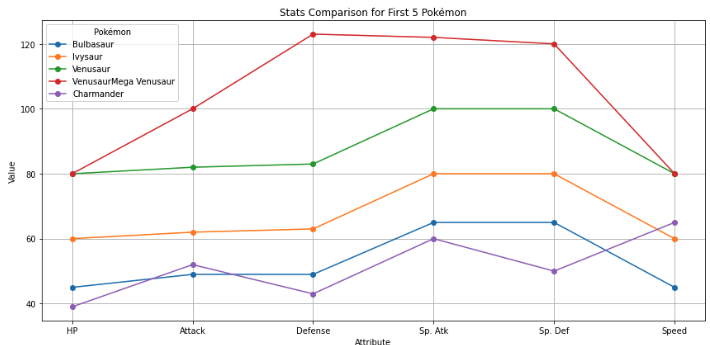
Line plot
- used to plot the trend of one number variable against a seconde variable.
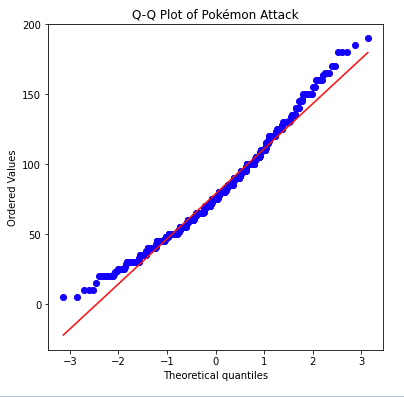
Quantile-Quantile (Q-Q) plot
- is a type of plot used to compare the distribution of a dataset with a theoretical distribution (like a normal distribution) or to compare two datasets to check if they follow the same distribution.
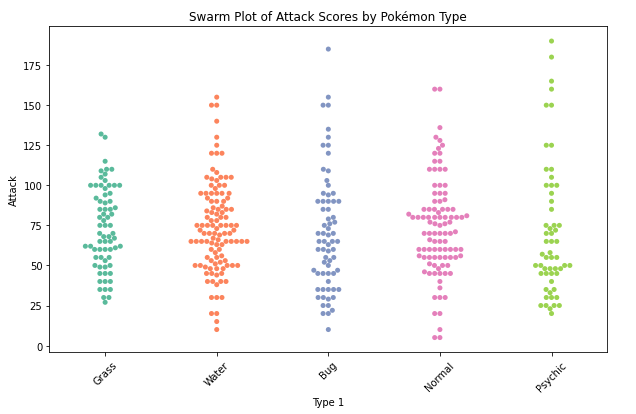
Swarm plot
- Like to a scatterplot, each data point is plotted with position according to its value on the two variables being plotted. Instead of randomly jittering points as in a normal scatterplot, points are placed as close to their actual value as possible without allowing any overlap.
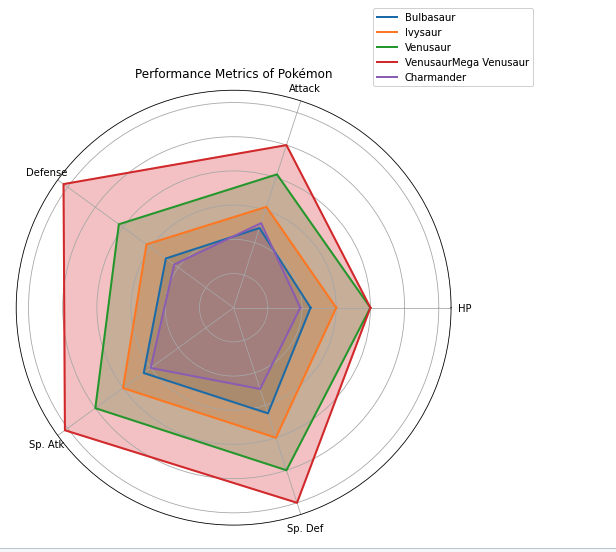
Spider plot
- compare multiple variables across different categories on a radial grid. Also know as radar chart.
Useful links
My sample notebook
Sample Code
Libs used for the sample plots:
- Matplotlib: a versatile library for visualizations, but it can take some code effort to put together common visualizations.
- Seaborn: built on top of matplotlib, adds a number of functions to make common statistical visualizations easier to generate.
- pandas: while this library includes some convenient methods for visualizing data that hook into matplotlib, we'll mainly be using it for its main purpose as a general tool for working with data (https://pandas.pydata.org/Pandas_Cheat_Sheet.pdf).
Further reading:
- Anscombes Quartett: Same stats for the data, but different distribution: https://en.wikipedia.org/wiki/Anscombe's_quartet
- Chartchunk: https://en.wikipedia.org/wiki/Chartjunk
- Data Ink Ratio: https://infovis-wiki.net/wiki/Data-Ink_Ratio
- Lie factor: https://infovis-wiki.net/wiki/Lie_Factor
- Tidy data: https://cran.r-project.org/web/packages/tidyr/vignettes/tidy-data.html
- Colorblind-friendly visualizations: https://www.tableau.com/blog/examining-data-viz-rules-dont-use-red-green-together
-
 Python 变量:命名规则和类型推断解释Python 是一种广泛使用的编程语言,以其简单性和可读性而闻名。了解变量的工作原理是编写高效 Python 代码的基础。在本文中,我们将介绍Python变量命名规则和类型推断,确保您可以编写干净、无错误的代码。 Python变量命名规则 在Python中命名变量时,必须遵循一定的...编程 发布于2024-11-08
 -
 如何同时高效地将多个列添加到 Pandas DataFrame 中?同时向 Pandas DataFrame 添加多个列在 Pandas 数据操作中,有效地向 DataFrame 添加多个新列可能是一项需要优雅解决方案的任务。虽然使用带有等号的列列表语法的直观方法可能看起来很简单,但它可能会导致意外的结果。挑战如提供的示例中所示,以下语法无法按预期创建新列:df[[...编程 发布于2024-11-08
 -
 从开发人员到高级架构师:技术专长和奉献精神的成功故事一个开发人员晋升为高级架构师的真实故事 一位熟练的Java EE开发人员,只有4年的经验,加入了一家跨国IT公司,并晋升为高级架构师。凭借多样化的技能和 Oracle 认证的 Java EE 企业架构师,该开发人员已经证明了他在架构领域的勇气。 加入公司后,开发人员被分配到一个项目,该公司在为汽车制...编程 发布于2024-11-08
 -
 如何在 PHP 8.1 中有条件地将元素添加到关联数组?条件数组元素添加在 PHP 中,有条件地将元素添加到关联数组的任务可能是一个挑战。例如,考虑以下数组:$arr = ['a' => 'abc'];我们如何有条件地添加 'b' => 'xyz'使用 array() 语句对此数组进行操作?在这种情况下,三元运算符不...编程 发布于2024-11-08
 -
 从打字机到像素:CMYK、RGB 和构建色彩可视化工具的旅程当我还是个孩子的时候,我出版了一本关于漫画的粉丝杂志。那是在我拥有计算机之前很久——它是用打字机、纸和剪刀创建的! 粉丝杂志最初是黑白的,在我的学校复印的。随着时间的推移,随着它取得了更大的成功,我能够负担得起带有彩色封面的胶印! 然而,管理这些颜色非常具有挑战性。每个封面必须打印四次,每种颜色打印...编程 发布于2024-11-08
 -
 如何将 Boehm 的垃圾收集器与 C++ 标准库集成?集成 Boehm 垃圾收集器和 C 标准库要将 Boehm 保守垃圾收集器与 C 标准库集合无缝集成,有两种主要方法:重新定义运算符::new此方法涉及重新定义运算符::new以使用Boehm的GC。但是,它可能与现有 C 代码冲突,并且可能无法在不同编译器之间移植。显式分配器参数您可以使用而不是重...编程 发布于2024-11-08
 -
 如何优化子集验证以获得顶级性能?优化子集验证:确保每一位都很重要确定一个列表是否是另一个列表的子集的任务在编程中经常遇到。虽然交叉列表和比较相等性是一种简单的方法,但考虑性能至关重要,尤其是对于大型数据集。考虑到这种情况,需要考虑的一个关键因素是任何列表在多个测试中是否保持不变。由于您的场景中的其中一个列表是静态的,因此我们可以利...编程 发布于2024-11-08
 -
 如何处理超出 MySQL BIGINT 限制的大整数?超出 MySQL BIGINT 限制的大整数处理MySQL 的 BIGINT 数据类型可能看起来是最广泛的整数表示形式,但是在处理时会出现限制超过 20 位的数字。超出 BIGINT 的选项边界当存储要求超出BIGINT的能力时,会出现两个选项:存储为VARCHAR: Twitter API建议将大...编程 发布于2024-11-08
 -
 如何确保 Python Selenium 中加载多个元素?Python Selenium:确保多个元素加载通过 AJAX 处理动态加载的元素时,确认其外观可能具有挑战性。为了处理这种情况,我们将利用 Selenium 的 WebDriverWait 及其各种策略来确保多个元素的存在。所有元素的可见性:验证所有与特定选择器匹配的元素,我们可以使用visi...编程 发布于2024-11-08
 -
 了解 JavaScript 中的标记模板文字什么是标记模板文字? 带标签的模板文字涉及以函数为前缀的模板文字,称为标签。该函数可以处理和操作文字的内容。这是一个简单的例子: function tag(strings, ...values) { console.log(strings); console.log...编程 发布于2024-11-08
 -
 如何消除Python打印语句中的空格?在 Python 打印语句中删除空格在 Python 中,打印多个项目通常会导致出现意外的空格。可以使用 sep 参数消除这些空格来解决此问题。例如,考虑这个:print("a", "b", "c")此输出将包含空格:a b c要消除它们:...编程 发布于2024-11-08
 -
 具有样式和变体的 Flexbox 按钮该按钮使用 CSS Flexbox 进行样式化,包括主要、次要和第三级样式,所有这些样式都在嵌套 CSS 中构建,以提高清晰度和可维护性,其变化形式如下: 带文字 带有文字和图标(左/右/左&右) 只有图标 状态 全角 残疾人类型 HTML代码: <a href="#" class="sf-b...编程 发布于2024-11-08
 -
 如何使用 PHP 在 Windows 计算机上安装 SSH2 扩展?在 Windows 计算机上使用 PHP 安装 SSH2 扩展在使用 Apache 的 Windows 计算机上安装 SSH2 扩展需要 OpenSSL 和 libssh2 库。这是分步指南:1。获取 PHP SSH2 PECL 扩展:从此处下载 Win32 SSH2 PECL 扩展,确保选择与您的...编程 发布于2024-11-08
学习中文
- 1 走路用中文怎么说?走路中文发音,走路中文学习
- 2 坐飞机用中文怎么说?坐飞机中文发音,坐飞机中文学习
- 3 坐火车用中文怎么说?坐火车中文发音,坐火车中文学习
- 4 坐车用中文怎么说?坐车中文发音,坐车中文学习
- 5 开车用中文怎么说?开车中文发音,开车中文学习
- 6 游泳用中文怎么说?游泳中文发音,游泳中文学习
- 7 骑自行车用中文怎么说?骑自行车中文发音,骑自行车中文学习
- 8 你好用中文怎么说?你好中文发音,你好中文学习
- 9 谢谢用中文怎么说?谢谢中文发音,谢谢中文学习
- 10 How to say goodbye in Chinese? 再见Chinese pronunciation, 再见Chinese learning


