Bokeh 是一个有趣的 Python 数据可视化数据工具
数据可视化在解释大量信息方面发挥着关键作用。 Bokeh 等工具已成为构建交互式仪表板和报告的流行解决方案。每个工具都具有独特的优势,具体取决于您项目的复杂性和您首选的编程语言。在本文中,我们将深入研究每个工具,然后重点关注 Bokeh,包括实践示例和云中的部署。
以便...
什么是散景?
Bokeh 是一个交互式可视化库,针对现代 Web 浏览器进行演示。它提供优雅简洁的图形,使开发人员能够构建具有高级交互性的仪表板。 Bokeh 特别适合使用 Python 的数据科学家和开发人员,提供高级界面和对绘图的精细控制。
如何使用这个工具?
- 安装依赖项:
pip 安装散景
pip 安装gunicorn
- 创建情节: 在这种情况下,我在主页中开发了两个图,然后我称为“app.py”

from bokeh.layouts import column
from bokeh.models import ColumnDataSource, Select
from bokeh.plotting import figure, curdoc
import numpy as np

# Sample data for line plot
line_data = {
    'x': [1, 2, 3, 4, 5],
    'y1': [6, 7, 2, 4, 7],
    'y2': [1, 4, 8, 6, 9]
}

# Data for scatter plot
N = 4000
x_scatter = np.random.random(size=N) * 100
y_scatter = np.random.random(size=N) * 100
radii = np.random.random(size=N) * 1.5
colors = np.array([(r, g, 150) for r, g in zip(50   2 * x_scatter, 30   2 * y_scatter)], dtype="uint8")

# Create ColumnDataSource for line plot
source = ColumnDataSource(data={'x': line_data['x'], 'y': line_data['y1']})

# Create a figure for line plot
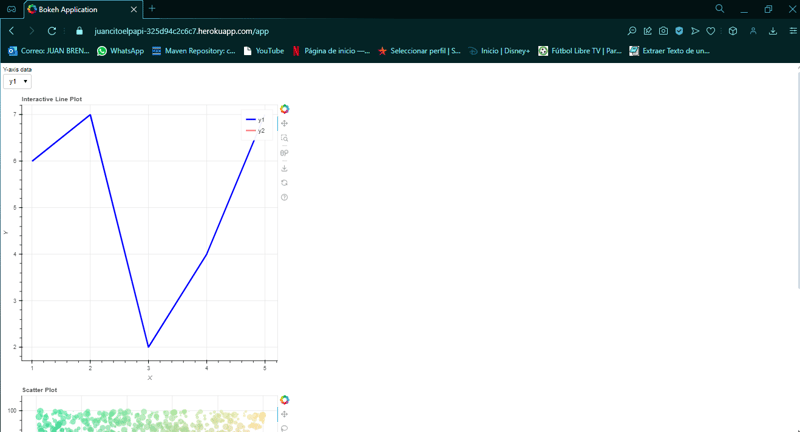
plot_line = figure(title="Interactive Line Plot", x_axis_label='X', y_axis_label='Y')
line1 = plot_line.line('x', 'y', source=source, line_width=3, color='blue', legend_label='y1')
line2 = plot_line.line('x', 'y2', source=source, line_width=3, color='red', legend_label='y2', line_alpha=0.5)

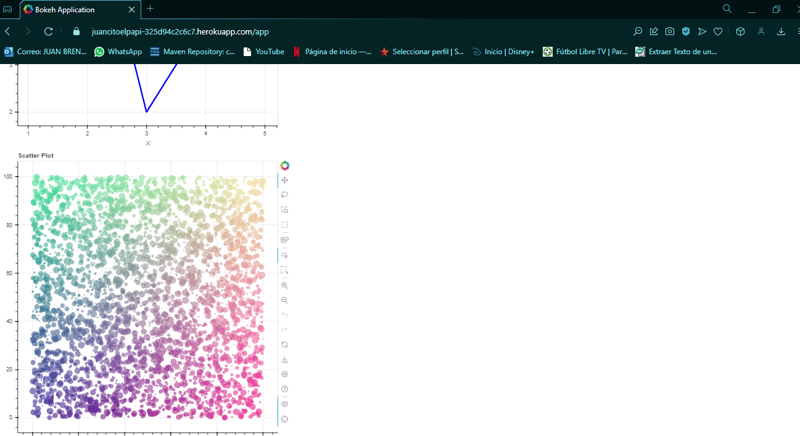
# Create a figure for scatter plot
plot_scatter = figure(title="Scatter Plot", tools="hover,crosshair,pan,wheel_zoom,zoom_in,zoom_out,box_zoom,undo,redo,reset,tap,save,box_select,poly_select,lasso_select,examine,help")
plot_scatter.circle(x_scatter, y_scatter, radius=radii,
                    fill_color=colors, fill_alpha=0.6,
                    line_color=None)

# Dropdown widget to select data for line plot
select = Select(title="Y-axis data", value='y1', options=['y1', 'y2'])

# Update function to change data based on selection
def update(attr, old, new):
    selected_y = select.value
    source.data = {'x': line_data['x'], 'y': line_data[selected_y]}
    # Update line colors based on selection
    line1.visible = (selected_y == 'y1')
    line2.visible = (selected_y == 'y2')
    plot_line.title.text = f"Interactive Line Plot - Showing {selected_y}"

select.on_change('value', update)

# Arrange plots and widgets in a layout
layout = column(select, plot_line, plot_scatter)

# Add layout to current document
curdoc().add_root(layout)
`
在 heroku 中创建页面并执行后续步骤。
- 创建Procfile:

在此文件中以我的情况为例进行声明。
网络:散景服务 --port=$PORT --address=0.0.0.0 --allow-websocket-origin=juancioelpapi-325d94c2c6c7.herokuapp.com app.py
- 创建需求: 在项目中创建requirements.txt并写入并保存

背景虚化
- 推送您的项目:
当您在 git 中推送项目时,情况类似,但在这种情况下,最终的主推送是在 heroku 中
git 初始化
git add .
git commit -m“使用 Gunicorn 部署 Bokeh 应用程序”
git push heroku master
- 最后...
您可以看到带有散景图的页面。


- 结论
Bokeh 的真正强大之处在于它能够在 Web 环境中提供交互式仪表板,使其成为实时数据监控和大型数据集的理想选择。通过使用 Gunicorn 在 Heroku 等云服务上部署 Bokeh 应用程序,您可以构建易于维护和更新的可扩展、生产就绪的仪表板。
-
 如何在GO编译器中自定义编译优化?在GO编译器中自定义编译优化 GO中的默认编译过程遵循特定的优化策略。 However, users may need to adjust these optimizations for specific requirements.Optimization Control in Go Compi...编程 发布于2025-04-05
 -
 Python读取CSV文件UnicodeDecodeError终极解决方法在试图使用已内置的CSV模块读取Python中时,CSV文件中的Unicode Decode Decode Decode Decode decode Error读取,您可能会遇到错误的错误:无法解码字节 在位置2-3中:截断\ uxxxxxxxx逃脱当CSV文件包含特殊字符或Unicode的路径逃...编程 发布于2025-04-05
 -
 为什么不使用CSS`content'属性显示图像?在Firefox extemers属性为某些图像很大,&& && && &&华倍华倍[华氏华倍华氏度]很少见,却是某些浏览属性很少,尤其是特定于Firefox的某些浏览器未能显示图像时未能显示图像时遇到了一个问题。这可以在提供的CSS类中看到:。googlepic { 内容:url(&#...编程 发布于2025-04-05
 -
 \“(1)vs.(;;):编译器优化是否消除了性能差异?\”答案: 在大多数现代编译器中,while(1)和(1)和(;;)之间没有性能差异。编译器: perl: 1 输入 - > 2 2 NextState(Main 2 -E:1)V-> 3 9 Leaveloop VK/2-> A 3 toterloop(next-> 8 last-> 9 ...编程 发布于2025-04-05
 -
 如何使用替换指令在GO MOD中解析模块路径差异?在使用GO MOD时,在GO MOD 中克服模块路径差异时,可能会遇到冲突,其中可能会遇到一个冲突,其中3派对软件包将另一个带有导入套件的path package the Imptioned package the Imptioned package the Imported tocted pac...编程 发布于2025-04-05
 -
 如何在其容器中为DIV创建平滑的左右CSS动画?通用CSS动画,用于左右运动 ,我们将探索创建一个通用的CSS动画,以向左和右移动DIV,从而到达其容器的边缘。该动画可以应用于具有绝对定位的任何div,无论其未知长度如何。问题:使用左直接导致瞬时消失 更加流畅的解决方案:混合转换和左 [并实现平稳的,线性的运动,我们介绍了线性的转换。这...编程 发布于2025-04-05
 -
 哪种在JavaScript中声明多个变量的方法更可维护?在JavaScript中声明多个变量:探索两个方法在JavaScript中,开发人员经常遇到需要声明多个变量的需要。对此的两种常见方法是:在单独的行上声明每个变量: 当涉及性能时,这两种方法本质上都是等效的。但是,可维护性可能会有所不同。 第一个方法被认为更易于维护。每个声明都是其自己的语句,使其...编程 发布于2025-04-05
 -
 为什么使用固定定位时,为什么具有100%网格板柱的网格超越身体?网格超过身体,用100%grid-template-columns 为什么在grid-template-colms中具有100%的显示器,当位置设置为设置的位置时,grid-template-colly修复了?问题: 考虑以下CSS和html: class =“ snippet-code”> g...编程 发布于2025-04-05
 -
 为什么PHP的DateTime :: Modify('+1个月')会产生意外的结果?使用php dateTime修改月份:发现预期的行为在使用PHP的DateTime类时,添加或减去几个月可能并不总是会产生预期的结果。正如文档所警告的那样,“当心”这些操作的“不像看起来那样直观。 考虑文档中给出的示例:这是内部发生的事情: 现在在3月3日添加另一个月,因为2月在2001年只有2...编程 发布于2025-04-05
 -
 如何使用Python理解有效地创建字典?在python中,词典综合提供了一种生成新词典的简洁方法。尽管它们与列表综合相似,但存在一些显着差异。与问题所暗示的不同,您无法为钥匙创建字典理解。您必须明确指定键和值。 For example:d = {n: n**2 for n in range(5)}This creates a dicti...编程 发布于2025-04-05
 -
 如何从Python中的字符串中删除表情符号:固定常见错误的初学者指南?从python import codecs import codecs import codecs 导入 text = codecs.decode('这狗\ u0001f602'.encode('utf-8'),'utf-8') 印刷(文字)#带有...编程 发布于2025-04-05
 -
 可以在纯CS中将多个粘性元素彼此堆叠在一起吗?[2这里: https://webthemez.com/demo/sticky-multi-header-scroll/index.html </main> <section> { display:grid; grid-template-...编程 发布于2025-04-05
 -
 在程序退出之前,我需要在C ++中明确删除堆的堆分配吗?在C中的显式删除 在C中的动态内存分配时,开发人员通常会想知道是否有必要在heap-procal extrable exit exit上进行手动调用“ delete”操作员,但开发人员通常会想知道是否需要手动调用“ delete”操作员。本文深入研究了这个主题。 在C主函数中,使用了动态分配变量(H...编程 发布于2025-04-05
 -
 如何在Java的全屏独家模式下处理用户输入?Handling User Input in Full Screen Exclusive Mode in JavaIntroductionWhen running a Java application in full screen exclusive mode, the usual event ha...编程 发布于2025-04-05
 -
 如何使用Python有效地以相反顺序读取大型文件?在python 中,如果您使用一个大文件,并且需要从最后一行读取其内容,则在第一行到第一行,Python的内置功能可能不合适。这是解决此任务的有效解决方案:反向行读取器生成器 == ord('\ n'): 缓冲区=缓冲区[:-1] ...编程 发布于2025-04-05
学习中文
- 1 走路用中文怎么说?走路中文发音,走路中文学习
- 2 坐飞机用中文怎么说?坐飞机中文发音,坐飞机中文学习
- 3 坐火车用中文怎么说?坐火车中文发音,坐火车中文学习
- 4 坐车用中文怎么说?坐车中文发音,坐车中文学习
- 5 开车用中文怎么说?开车中文发音,开车中文学习
- 6 游泳用中文怎么说?游泳中文发音,游泳中文学习
- 7 骑自行车用中文怎么说?骑自行车中文发音,骑自行车中文学习
- 8 你好用中文怎么说?你好中文发音,你好中文学习
- 9 谢谢用中文怎么说?谢谢中文发音,谢谢中文学习
- 10 How to say goodbye in Chinese? 再见Chinese pronunciation, 再见Chinese learning


