Debug without Breakpoints
Read in other languages: English Español 中文
In a typical debugging scenario, you would set breakpoints to tell the debugger when to suspend your program. A breakpoint usually corresponds to the moment that marks the starting point for further investigation.
Deciding where to set a breakpoint can be challenging. There may be situations where the exact line is unclear, or you may prefer to pause the program based on time rather than specific code.
In this article, we'll take a look at IntelliJ IDEA's Pause Program functionality – a lesser-known debugging technique that can be extremely powerful in some scenarios, including those described above. We will discuss its use cases and limitations, as well as discover the secret step by step.
What is Pause?
Pause Program is a feature of the IntelliJ IDEA debugger that allows you to arbitrarily pause your application at any point in time. Furthermore, you don't even need to know the application code. In fact, you can just ignore it!
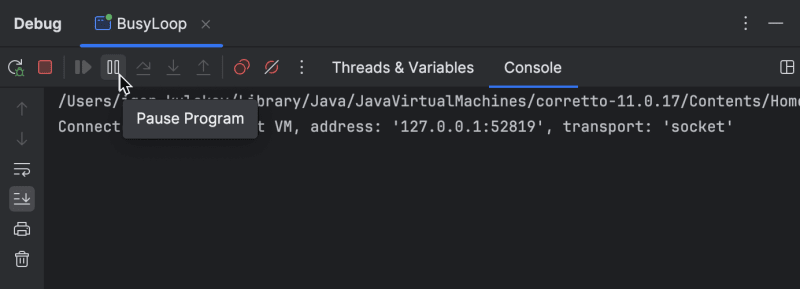
To pause a program, click Pause Program on the debugger toolbar. Then, the program will stop right in the middle of whatever you are doing.
Limitations
At first glance, a paused program may look exactly like one that has been suspended at a breakpoint. However, this is only true to a certain extent.
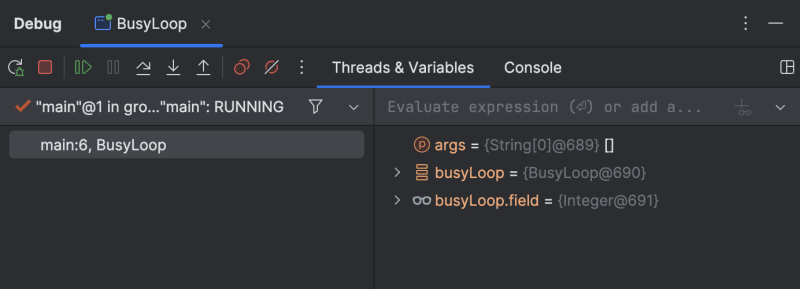
It would be correct to consider Pause Program a kind of thread dump plus. You can still inspect both variables and threads the way you normally would. However, some of the more advanced features, such as Evaluate Expression, will not work.
Use cases
There are countless ways to use Pause Program. It can often be used interchangeably with traditional breakpoints. However, there are scenarios where using Pause Program is a more appropriate approach. Let's consider some of them.
Irresponsive apps
If you encounter a user interface (UI) freeze, it is usually due to the UI thread being blocked.
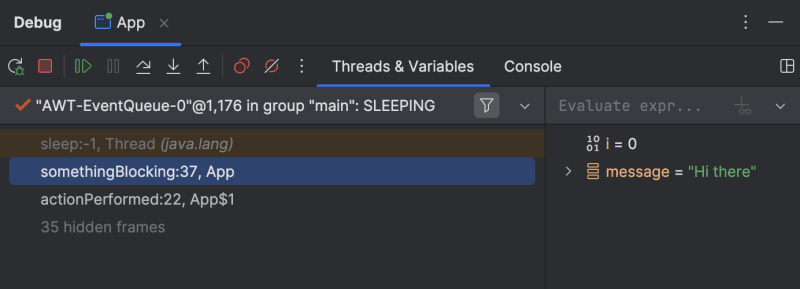
Pause Program could be useful in this case, as it allows you to pause the application while it is unresponsive and examine the UI thread's call stack. This is usually enough to diagnose the problem.
Missing fonts
As mentioned earlier, Pause Program allows you to simply ignore the source code, which may be missing for you anyway. Although this scenario is not very common, when you come across it, breakpoints would not be of any help.
This is where Pause Program comes into play!

Locks
If you suspect a synchronization problem, such as a deadlock or livelock, Pause Program can help you find the exact threads and locks that are causing the problem.
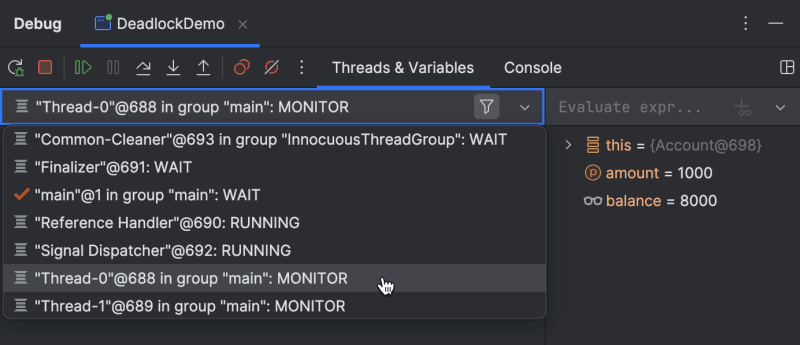
In this case, pause the program and inspect the thread list. It will show which threads are blocked. When you navigate to the execution point, you will also see the critical sections where they are locked. This information can help guide you toward a solution.
Secret step-by-step tip
As I mentioned earlier, Pause Program limits your access to some of the debugger's advanced functionality. If you have tried to use certain features while an application is paused, you may have seen an error message that says Cannot evaluate methods after Pause action.
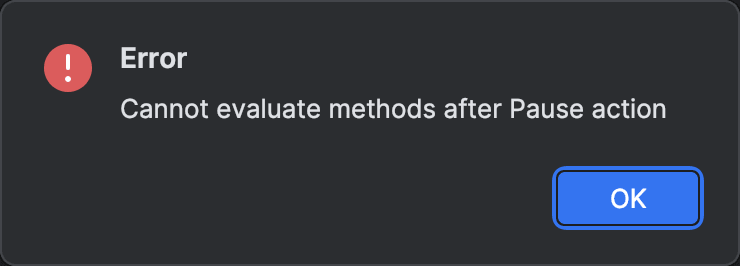
However, there is a shortcut to this restriction.
After you have paused an application, continue performing any action step by step. Step Into or Step Over will do. Once this is done, you will be in a regular debugging session, similar to when you suspend an application using a breakpoint. All advanced features are now unlocked!
Conclusion
That's it for today! I hope you find these tips and tricks helpful.
If you are interested in more articles related to debugging and profiling, check out some of my other articles:
- Debugger.godMode() – Hack a JVM Application with the Debugger
- Debugger Slow Troubleshooting
- Debugging Inactive Applications
- What's Wrong with createDirectories()? - CPU Profile Guide
If there's anything specific about debugging in Java that you want me to cover, don't hesitate to get in touch! Your opinion will help prioritize and publish the content that is most interesting to you.
-
 What Happened to Column Offsetting in Bootstrap 4 Beta?Bootstrap 4 Beta: The Removal and Restoration of Column OffsettingBootstrap 4, in its Beta 1 release, introduced significant changes to the way column...Programming Published on 2024-11-16
 -
 How Can I Effectively Control JVM Memory Consumption?Controlling JVM Memory ConsumptionIn order to allocate the appropriate resources for optimal application performance, it is crucial to set the maximum...Programming Published on 2024-11-16
 -
 Beyond `if` Statements: Where Else Can a Type with an Explicit `bool` Conversion Be Used Without Casting?Contextual Conversion to bool Allowed Without a CastYour class defines an explicit conversion to bool, enabling you to use its instance 't' di...Programming Published on 2024-11-16
 -
 How Can I Find Users with Today\'s Birthdays Using MySQL?How to Identify Users with Today's Birthdays Using MySQLDetermining if today is a user's birthday using MySQL involves finding all rows where ...Programming Published on 2024-11-16
 -
 Interactive Gladiator Battle Simulation | GladiatorsBattle.comStep into the arena with this interactive Gladiator Battle Simulation! Control two mighty gladiators, each with unique actions like attack, defend, an...Programming Published on 2024-11-16
 -
 How to Correctly Set the User-Agent in Java URLConnection?Setting User Agent of a Java URLConnectionWhen attempting to parse a webpage using Java with URLConnection and setting the user-agent to a specified v...Programming Published on 2024-11-16
 -
 Using WebSockets in Go for Real-Time CommunicationBuilding apps that require real-time updates—like chat applications, live notifications, or collaborative tools—requires a communication method faster...Programming Published on 2024-11-16
 -
 How to Remove Line Breaks from Text When Reading a File?Eliminating Line Breaks from TextIn the provided code snippet, you're encountering an issue where line breaks are inadvertently added to each line...Programming Published on 2024-11-16
 -
 Java Virtual Machine: lifecycle and Class LoadersThe Java Virtual Machine (JVM) is the core of the Java ecosystem, providing all the essential tools for running Java code. To fully understand how it ...Programming Published on 2024-11-16
 -
 Here are some question-based titles that align with the content of your JavaScript integer verification article: Focusing on reliability and best practices: * How to Reliably Verify Integers in JavaHow to Verify Integer Variables in JavaScript and Raise Errors for Non-Integer ValuesDetermining if a JavaScript variable represents an integer can be...Programming Published on 2024-11-16
 -
 Cool CodePen Demos (October 4)Lightweight Water Distortion Effect Ksenia Kondrashova created a demo with a beautiful shader with a water effect. It looks realistic, like w...Programming Published on 2024-11-16
 -
 How To Calculate the Sum of a Value in SQL While Ensuring Each Row is Counted Only Once?Grouping Rows in SQL Using SUM() for Distinct ValuesIn your MySQL query, you want to calculate the sum of a value in the conversions table while ensur...Programming Published on 2024-11-16
 -
 Handling Environment Variables in ViteIn modern web development, managing sensitive data such as API keys, database credentials, and various configurations for different environments is es...Programming Published on 2024-11-16
 -
 How to Efficiently Handle Foreign Key Assignment in Nested Serializers with Django REST Framework?Foreign Key Assignment with Nested Serializers in Django REST FrameworkDjango REST Framework (DRF) provides a convenient way to manage foreign key rel...Programming Published on 2024-11-16
 -
 How to Remove "index.php" from CodeIgniter URLs?CodeIgniter .htaccess and URL Rewriting IssuesNavigating CodeIgniter applications often requires removing "index.php" from the URL, allowing...Programming Published on 2024-11-16
Study Chinese
- 1 How do you say "walk" in Chinese? 走路 Chinese pronunciation, 走路 Chinese learning
- 2 How do you say "take a plane" in Chinese? 坐飞机 Chinese pronunciation, 坐飞机 Chinese learning
- 3 How do you say "take a train" in Chinese? 坐火车 Chinese pronunciation, 坐火车 Chinese learning
- 4 How do you say "take a bus" in Chinese? 坐车 Chinese pronunciation, 坐车 Chinese learning
- 5 How to say drive in Chinese? 开车 Chinese pronunciation, 开车 Chinese learning
- 6 How do you say swimming in Chinese? 游泳 Chinese pronunciation, 游泳 Chinese learning
- 7 How do you say ride a bicycle in Chinese? 骑自行车 Chinese pronunciation, 骑自行车 Chinese learning
- 8 How do you say hello in Chinese? 你好Chinese pronunciation, 你好Chinese learning
- 9 How do you say thank you in Chinese? 谢谢Chinese pronunciation, 谢谢Chinese learning
- 10 How to say goodbye in Chinese? 再见Chinese pronunciation, 再见Chinese learning


