
使用 Pandas 進行 JIRA 分析
 瀏覽:456
Problem
It's hard to argue Atlassian JIRA is one of the most popular issue trackers and project management solutions. You can love it, you can hate it, but if you were hired as a software engineer for some company, there is a high probability of meeting JIRA.
If the project you are working on is very active, there can be thousands of JIRA issues of various types. If you are leading a team of engineers, you can be interested in analytical tools that can help you understand what is going on in the project based on data stored in JIRA. JIRA has some reporting facilities integrated, as well as 3rd party plugins. But most of them are pretty basic. For example, it's hard to find rather flexible "forecasting" tools.
The bigger the project, the less satisfied you are with integrated reporting tools. At some point, you will end up using an API to extract, manipulate, and visualize the data. During the last 15 years of JIRA usage, I saw dozens of such scripts and services in various programming languages around this domain.
Many day-to-day tasks may require one-time data analysis, so writing services every time doesn't pay off. You can treat JIRA as a data source and use a typical data analytics tool belt. For example, you may take Jupyter, fetch the list of recent bugs in the project, prepare a list of "features" (attributes valuable for analysis), utilize pandas to calculate the statistics, and try to forecast trends using scikit-learn. In this article, I would like to explain how to do it.
Preparation
JIRA API Access
Here, we will talk about the cloud version of JIRA. But if you are using a self-hosted version, the main concepts are almost the same.
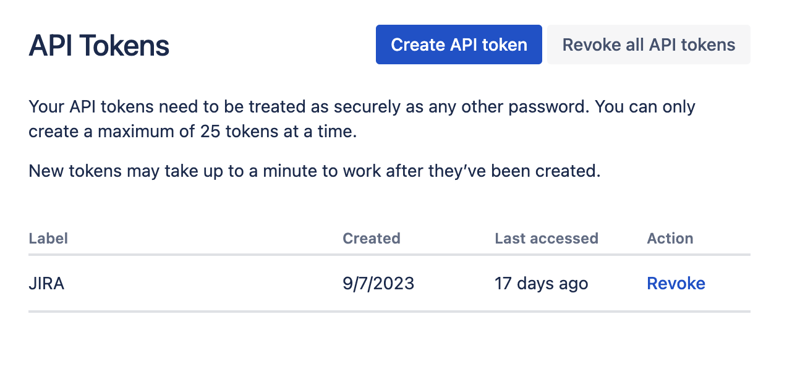
First of all, we need to create a secret key to access JIRA via REST API. To do so, go to profile management - https://id.atlassian.com/manage-profile/profile-and-visibility If you select the "Security" tab, you will find the "Create and manage API tokens" link:
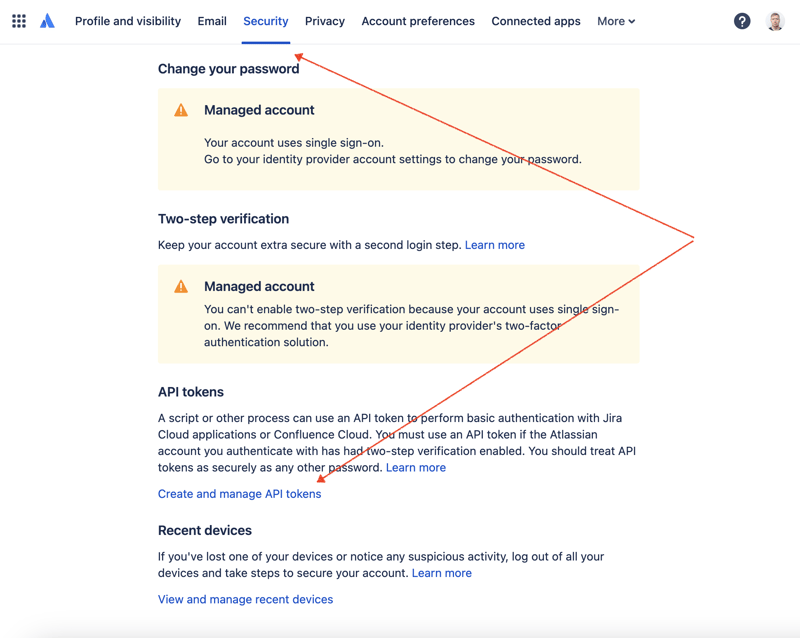
Create a new API token here and store it securely. We will use this token later.
Jupyter Notebooks
One of the most convenient ways to play with datasets is to utilize Jupyter. If you are not familiar with this tool, do not worry. I will show how to use it to solve our problem. For local experiments, I like to use DataSpell by JetBrains, but there are services available online and for free. One of the most well-known services among data scientists is Kaggle. However, their notebooks don't allow you to make external connections to access JIRA via API. Another very popular service is Colab by Google. It allows you to make remote connections and install additional Python modules.
JIRA has a pretty easy-to-use REST API. You can make API calls using your favorite way of doing HTTP requests and parse the response manually. However, we will utilize an excellent and very popular jira module for that purpose.
Tools in Action
Data Analysis
Let's combine all the parts to come up with the solution.
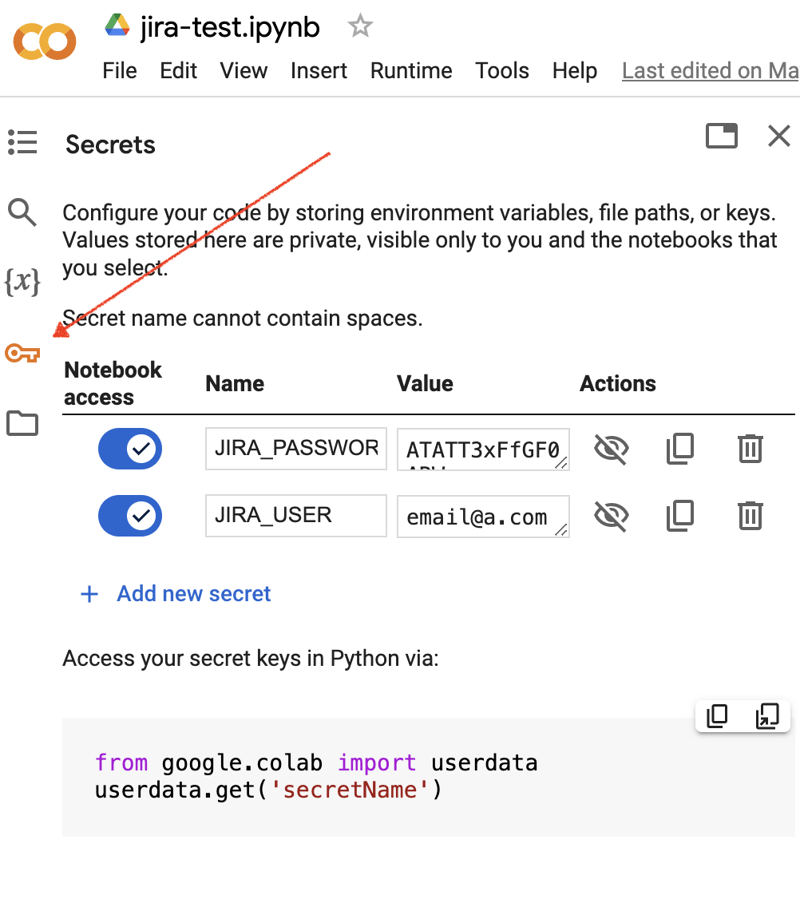
Go to the Google Colab interface and create a new notebook. After the notebook creation, we need to store previously obtained JIRA credentials as "secrets." Click the "Key" icon in the left toolbar to open the appropriate dialog and add two "secrets" with the following names: JIRA_USER and JIRA_PASSWORD. At the bottom of the screen, you can see the way how to access these "secrets":
The next thing is to install an additional Python module for JIRA integration. We can do it by executing the shell command in the scope of the notebook cell:
!pip install jira
The output should look something like the following:
Collecting jira
  Downloading jira-3.8.0-py3-none-any.whl (77 kB)
     ━━━━━━━━━━━━━━━━━━━━━━━━━━━━━━━━━━━━━━━━ 77.5/77.5 kB 1.3 MB/s eta 0:00:00
Requirement already satisfied: defusedxml in /usr/local/lib/python3.10/dist-packages (from jira) (0.7.1)
...
Installing collected packages: requests-toolbelt, jira
Successfully installed jira-3.8.0 requests-toolbelt-1.0.0
We need to fetch the "secrets"/credentials:
from google.colab import userdata

JIRA_URL = 'https://******.atlassian.net'
JIRA_USER = userdata.get('JIRA_USER')
JIRA_PASSWORD = userdata.get('JIRA_PASSWORD')
And validate the connection to the JIRA Cloud:
from jira import JIRA

jira = JIRA(JIRA_URL, basic_auth=(JIRA_USER, JIRA_PASSWORD))
projects = jira.projects()
projects
If the connection is ok and the credentials are valid, you should see a non-empty list of your projects:
[,
 ,
 ,
...
So we can connect and fetch data from JIRA. The next step is to fetch some data for analysis with pandas. Let’s try to fetch the list of solved problems during the last several weeks for some project:
JIRA_FILTER = 19762

issues = jira.search_issues(
    f'filter={JIRA_FILTER}',
    maxResults=False,
    fields='summary,issuetype,assignee,reporter,aggregatetimespent',
)
We need to transform the dataset into the pandas data frame:
import pandas as pd

df = pd.DataFrame([{
    'key': issue.key,
    'assignee': issue.fields.assignee and issue.fields.assignee.displayName or issue.fields.reporter.displayName,
    'time': issue.fields.aggregatetimespent,
    'summary': issue.fields.summary,
} for issue in issues])

df.set_index('key', inplace=True)

df
The output may look like the following:
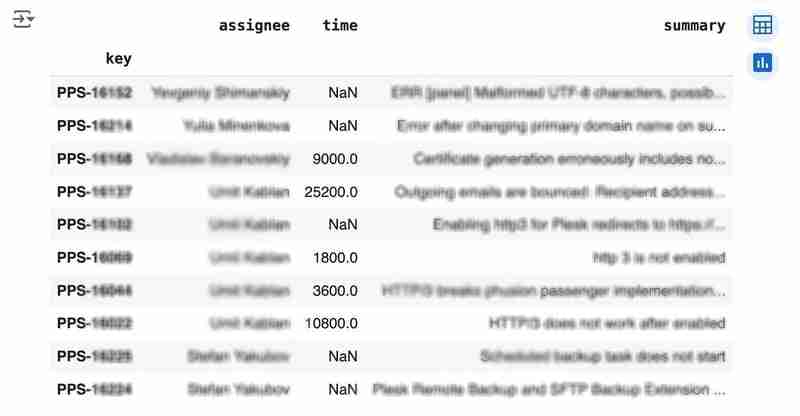
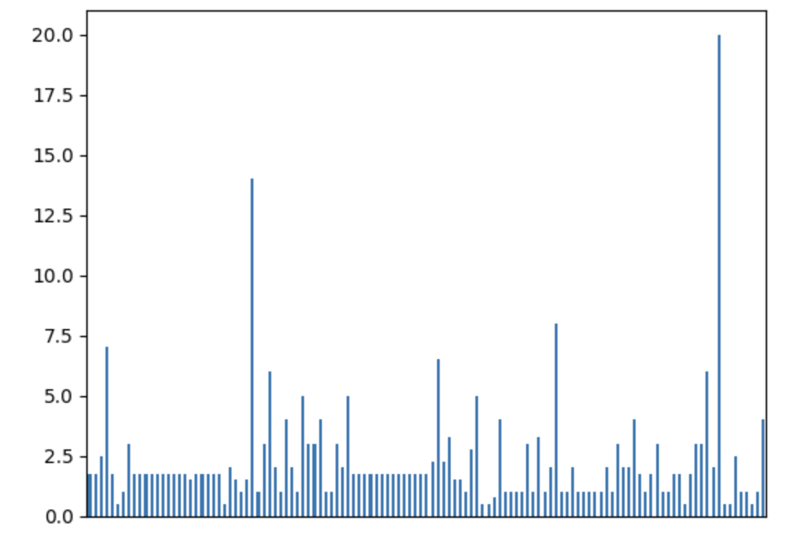
We would like to analyze how much time it usually takes to solve the issue. People are not ideal, so sometimes they forget to log the work. It brings a headache if you try to analyze such data using JIRA built-in tools. But it's not a problem for us to make some adjustments using pandas. For example, we can transform the "time" field from seconds into hours and replace the absent values with the median value (beware, dropna can be more suitable if there are a lot of gaps):
df['time'].fillna(df['time'].median(), inplace=True)
df['time'] = df['time'] / 3600
We can easily visualize the distribution to find out anomalies:
df['time'].plot.bar(xlabel='', xticks=[])
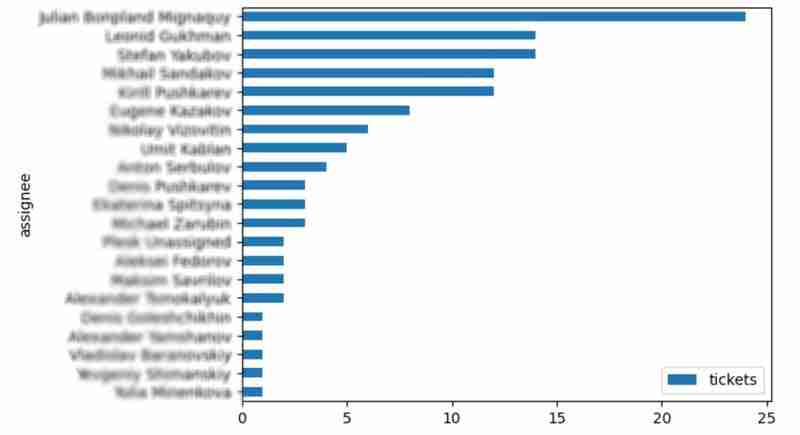
It is also interesting to see the distribution of solved problems by the assignee:
top_solvers = df.groupby('assignee').count()[['time']]
top_solvers.rename(columns={'time': 'tickets'}, inplace=True)
top_solvers.sort_values('tickets', ascending=False, inplace=True)

top_solvers.plot.barh().invert_yaxis()
It may look like the following:
Predictions
Let's try to predict the amount of time required to finish all open issues. Of course, we can do it without machine learning by using simple approximation and the average time to resolve the issue. So the predicted amount of required time is the number of open issues multiplied by the average time to resolve one. For example, the median time to solve one issue is 2 hours, and we have 9 open issues, so the time required to solve them all is 18 hours (approximation). It's a good enough forecast, but we might know the speed of solving depends on the product, team, and other attributes of the issue. If we want to improve the prediction, we can utilize machine learning to solve this task.
The high-level approach looks the following:
- Obtain the dataset for “learning”
- Clean up the data
- Prepare the "features" aka "feature engineering"
- Train the model
- Use the model to predict some value of the target dataset
For the first step, we will use a dataset of tickets for the last 30 weeks. Some parts here are simplified for illustrative purposes. In real life, the amount of data for learning should be big enough to make a useful model (e.g., in our case, we need thousands of issues to be analyzed).
issues = jira.search_issues(
    f'project = PPS AND status IN (Resolved) AND created >= -30w',
    maxResults=False,
    fields='summary,issuetype,customfield_10718,customfield_10674,aggregatetimespent',
)

closed_tickets = pd.DataFrame([{
    'key': issue.key,
    'team': issue.fields.customfield_10718,
    'product': issue.fields.customfield_10674,
    'time': issue.fields.aggregatetimespent,
} for issue in issues])

closed_tickets.set_index('key', inplace=True)
closed_tickets['time'].fillna(closed_tickets['time'].median(), inplace=True)

closed_tickets
In my case, it's something around 800 tickets and only two fields for "learning": "team" and "product."
The next step is to obtain our target dataset. Why do I do it so early? I want to clean up and do "feature engineering" in one shot for both datasets. Otherwise, the mismatch between the structures can cause problems.
issues = jira.search_issues(
    f'project = PPS AND status IN (Open, Reopened)',
    maxResults=False,
    fields='summary,issuetype,customfield_10718,customfield_10674',
)

open_tickets = pd.DataFrame([{
    'key': issue.key,
    'team': issue.fields.customfield_10718,
    'product': issue.fields.customfield_10674,
} for issue in issues])

open_tickets.set_index('key', inplace=True)

open_tickets
Please notice we have no "time" column here because we want to predict it. Let's nullify it and combine both datasets to prepare the "features."
open_tickets['time'] = 0
tickets = pd.concat([closed_tickets, open_tickets])

tickets
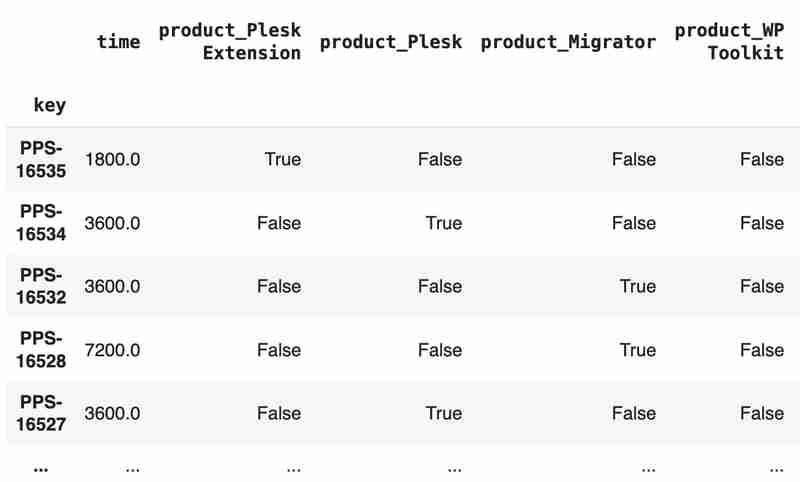
Columns "team" and "product" contain string values. One of the ways of dealing with that is to transform each value into separate fields with boolean flags.
products = pd.get_dummies(tickets['product'], prefix='product')
tickets = pd.concat([tickets, products], axis=1)
tickets.drop('product', axis=1, inplace=True)

teams = pd.get_dummies(tickets['team'], prefix='team')
tickets = pd.concat([tickets, teams], axis=1)
tickets.drop('team', axis=1, inplace=True)

tickets
The result may look like the following:
After the combined dataset preparation, we can split it back into two parts:
closed_tickets = tickets[:len(closed_tickets)]
open_tickets = tickets[len(closed_tickets):][:]
Now it's time to train our model:
from sklearn.model_selection import train_test_split
from sklearn.tree import DecisionTreeRegressor

features = closed_tickets.drop(['time'], axis=1)
labels = closed_tickets['time']

features_train, features_val, labels_train, labels_val = train_test_split(features, labels, test_size=0.2)

model = DecisionTreeRegressor()
model.fit(features_train, labels_train)
model.score(features_val, labels_val)
And the final step is to use our model to make a prediction:
open_tickets['time'] = model.predict(open_tickets.drop('time', axis=1, errors='ignore'))
open_tickets['time'].sum() / 3600
The final output, in my case, is 25 hours, which is higher than our initial rough estimation. This was a basic example. However, by using ML tools, you can significantly expand your abilities to analyze JIRA data.
Conclusion
Sometimes, JIRA built-in tools and plugins are not sufficient for effective analysis. Moreover, many 3rd party plugins are rather expensive, costing thousands of dollars per year, and you will still struggle to make them work the way you want. However, you can easily utilize well-known data analysis tools by fetching necessary information via JIRA API and go beyond these limitations. I spent so many hours playing with various JIRA plugins in attempts to create good reports for projects, but they often missed some important parts. Building a tool or a full-featured service on top of JIRA API also often looks like overkill. That's why typical data analysis and ML tools like Jupiter, pandas, matplotlib, scikit-learn, and others may work better here.

-
 如何實時捕獲和流媒體以進行聊天機器人命令執行?在開發能夠執行命令的chatbots的領域中,實時從命令執行實時捕獲Stdout,一個常見的需求是能夠檢索和顯示標準輸出(stdout)在cath cath cant cant cant cant cant cant cant cant interfaces in Chate cant inter...程式設計 發佈於2025-07-06
 -
為什麼HTML無法打印頁碼及解決方案無法在html頁面上打印頁碼? @page規則在@Media內部和外部都無濟於事。 HTML:Customization:@page { margin: 10%; @top-center { font-family: sans-serif; font-weight: ...程式設計 發佈於2025-07-06
-
如何同步迭代並從PHP中的兩個等級陣列打印值?同步的迭代和打印值來自相同大小的兩個數組使用兩個數組相等大小的selectbox時,一個包含country代碼的數組,另一個包含鄉村代碼,另一個包含其相應名稱的數組,可能會因不當提供了exply for for for the uncore for the forsion for for ytry...程式設計 發佈於2025-07-06
-
eval()vs. ast.literal_eval():對於用戶輸入,哪個Python函數更安全?稱量()和ast.literal_eval()中的Python Security 在使用用戶輸入時,必須優先確保安全性。強大的Python功能Eval()通常是作為潛在解決方案而出現的,但擔心其潛在風險。 This article delves into the differences betwee...程式設計 發佈於2025-07-06
-
Go web應用何時關閉數據庫連接?在GO Web Applications中管理數據庫連接很少,考慮以下簡化的web應用程序代碼:出現的問題:何時應在DB連接上調用Close()方法? ,該特定方案將自動關閉程序時,該程序將在EXITS EXITS EXITS出現時自動關閉。但是,其他考慮因素可能保證手動處理。 選項1:隱式關閉終...程式設計 發佈於2025-07-06
-
編譯器報錯“usr/bin/ld: cannot find -l”解決方法錯誤:“ usr/bin/ld:找不到-l “ 此錯誤表明鏈接器在鏈接您的可執行文件時無法找到指定的庫。為了解決此問題,我們將深入研究如何指定庫路徑並將鏈接引導到正確位置的詳細信息。 添加庫搜索路徑的一個可能的原因是,此錯誤是您的makefile中缺少庫搜索路徑。要解決它,您可以在鏈接器命令中添...程式設計 發佈於2025-07-06
-
解決MySQL插入Emoji時出現的\\"字符串值錯誤\\"異常Resolving Incorrect String Value Exception When Inserting EmojiWhen attempting to insert a string containing emoji characters into a MySQL database us...程式設計 發佈於2025-07-06
-
在UTF8 MySQL表中正確將Latin1字符轉換為UTF8的方法在UTF8表中將latin1字符轉換為utf8 ,您遇到了一個問題,其中含義的字符(例如,“jáuòiñe”)在utf8 table tabled tablesset中被extect(例如,“致電。為了解決此問題,您正在嘗試使用“ mb_convert_encoding”和“ iconv”轉換受...程式設計 發佈於2025-07-06
-
如何使用node-mysql在單個查詢中執行多個SQL語句?Multi-Statement Query Support in Node-MySQLIn Node.js, the question arises when executing multiple SQL statements in a single query using the node-mys...程式設計 發佈於2025-07-06
-
如何解決AppEngine中“無法猜測文件類型,使用application/octet-stream...”錯誤?appEngine靜態文件mime type override ,靜態文件處理程序有時可以覆蓋正確的mime類型,在錯誤消息中導致錯誤消息:“無法猜測mimeType for for file for file for [File]。 application/application/octet...程式設計 發佈於2025-07-06
-
Spark DataFrame添加常量列的妙招在Spark Dataframe ,將常數列添加到Spark DataFrame,該列具有適用於所有行的任意值的Spark DataFrame,可以通過多種方式實現。使用文字值(SPARK 1.3)在嘗試提供直接值時,用於此問題時,旨在為此目的的column方法可能會導致錯誤。 df.withco...程式設計 發佈於2025-07-06
-
同實例無需轉儲複製MySQL數據庫方法在同一實例上複製一個MySQL數據庫而無需轉儲在同一mySQL實例上複製數據庫,而無需創建InterMediate sqql script。以下方法為傳統的轉儲和IMPORT過程提供了更簡單的替代方法。 直接管道數據 MySQL手動概述了一種允許將mysqldump直接輸出到MySQL cli...程式設計 發佈於2025-07-06
-
如何使用替換指令在GO MOD中解析模塊路徑差異?在使用GO MOD時,在GO MOD 中克服模塊路徑差異時,可能會遇到衝突,其中3個Party Package將另一個PAXPANCE帶有導入式套件之間的另一個軟件包,並在導入式套件之間導入另一個軟件包。如迴聲消息所證明的那樣: go.etcd.io/bbolt [&&&&&&&&&&&&&&&&...程式設計 發佈於2025-07-06
-
FastAPI自定義404頁面創建指南response = await call_next(request) if response.status_code == 404: return RedirectResponse("https://fastapi.tiangolo.com") else: ...程式設計 發佈於2025-07-06
-
如何使用不同數量列的聯合數據庫表?合併列數不同的表 當嘗試合併列數不同的數據庫表時,可能會遇到挑戰。一種直接的方法是在列數較少的表中,為缺失的列追加空值。 例如,考慮兩個表,表 A 和表 B,其中表 A 的列數多於表 B。為了合併這些表,同時處理表 B 中缺失的列,請按照以下步驟操作: 確定表 B 中缺失的列,並將它們添加到表的...程式設計 發佈於2025-07-06


學習中文
- 1 走路用中文怎麼說? 走路中文發音,走路中文學習
- 2 坐飛機用中文怎麼說? 坐飞机中文發音,坐飞机中文學習
- 3 坐火車用中文怎麼說? 坐火车中文發音,坐火车中文學習
- 4 坐車用中文怎麼說? 坐车中文發音,坐车中文學習
- 5 開車用中文怎麼說? 开车中文發音,开车中文學習
- 6 游泳用中文怎麼說? 游泳中文發音,游泳中文學習
- 7 騎自行車用中文怎麼說? 骑自行车中文發音,骑自行车中文學習
- 8 你好用中文怎麼說? 你好中文發音,你好中文學習
- 9 謝謝用中文怎麼說? 谢谢中文發音,谢谢中文學習
- 10 How to say goodbye in Chinese? 再见Chinese pronunciation, 再见Chinese learning


