멀티밴드 래스터 처리(Sentinel-hndex 및 인덱스 생성)
안녕하세요. 이전 블로그에서 단일 밴드 래스터에 대해 h3 인덱스와 postgresql을 사용하여 래스터 분석을 수행하는 방법에 대해 이야기했습니다. 이 블로그에서는 멀티밴드 래스터를 처리하고 쉽게 인덱스를 생성하는 방법에 대해 설명합니다. sentinel-2 이미지를 사용하고 처리된 h3 셀에서 NDVI를 생성하고 결과를 시각화합니다
Sentinel 2 데이터 다운로드
우리는 네팔 포카라 지역의 https://apps.sentinel-hub.com/eo-browser/에서 sentinel 2 데이터를 다운로드하고 있습니다. 호수가 이미지 그리드에 있는지 확인하여 쉽게 확인할 수 있습니다. NDVI 결과를 검증하기 위해 우리에게 연락하세요
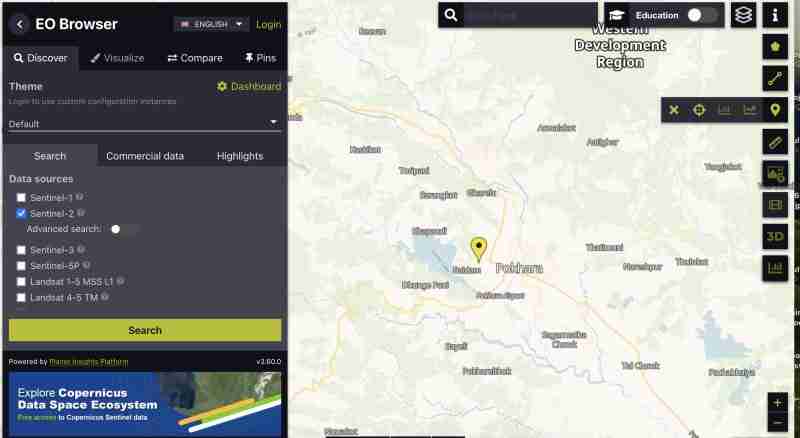
모든 밴드의 센티넬 이미지를 다운로드하려면:
- 계정을 만들어야 합니다.
- 해당 지역의 이미지 찾기 관심 지역을 포함하는 그리드를 선택하세요.
- 그리드를 확대하고 오른쪽 수직 막대의
 아이콘을 클릭합니다.
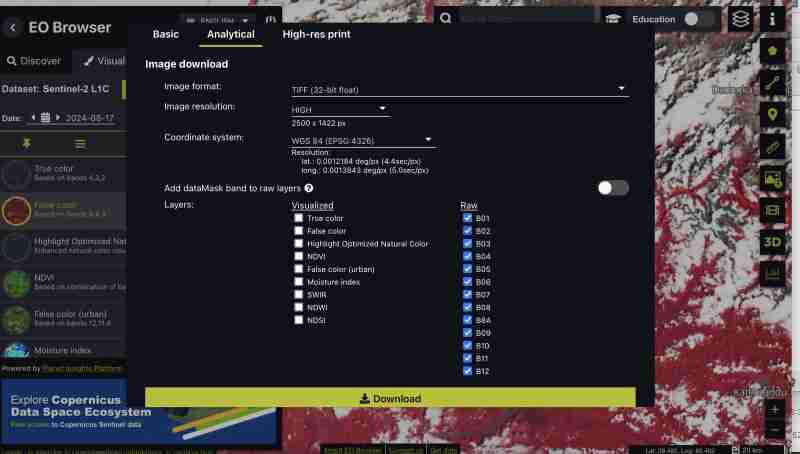
 - 그런 다음 분석 탭으로 이동하여 이미지 형식이 tiff 32비트, 고해상도, wgs1984 형식인 모든 밴드를 선택하고 모든 밴드를 선택합니다.
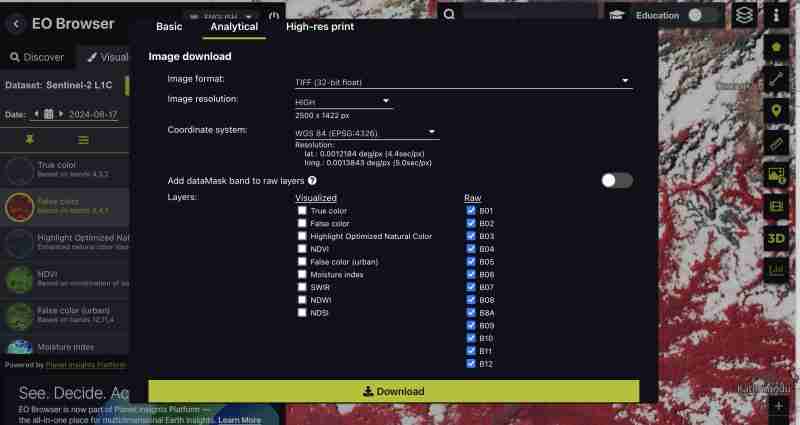
또한 NDVI, False color tiff only 또는 특정 밴드 등 필요에 가장 적합한 사전 생성된 색인을 다운로드할 수도 있습니다. 우리는 스스로 처리를 하고 싶어서 모든 밴드를 다운로드하고 있습니다.
- 다운로드 클릭
전처리
원시 형식을 다운로드할 때 모든 밴드를 센티넬과 별도의 tiff로 얻습니다.
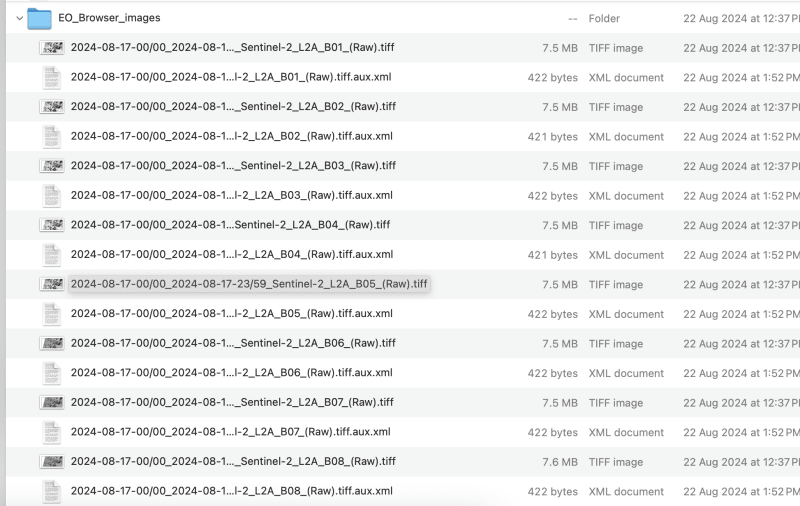
- 합성 이미지를 만들어 보겠습니다.
이 작업은 GIS 도구 또는 gdal을 통해 수행할 수 있습니다.
- gdal_merge 사용:
파일 이름에 슬래시가 들어가지 않도록 다운로드한 파일의 이름을 band1,band2로 바꿔야 합니다.
이 연습에서는 밴드 9까지 처리하겠습니다. 요구 사항에 따라 밴드를 선택할 수 있습니다.
gdal_merge.py -separate -o sentinel2_composite.tif band1.tif band2.tif band3.tif band4.tif band5.tif band6.tif band7.tif band8.tif band9.tif
- QGIS 사용하기 :
- 모든 개별 밴드를 QGIS에 로드
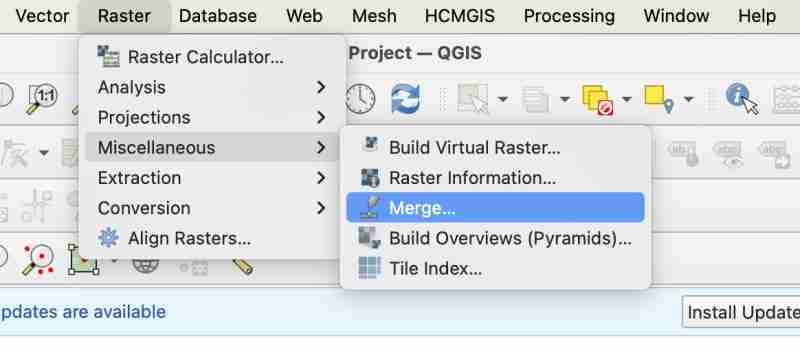
- 래스터 > 기타 > 병합으로 이동
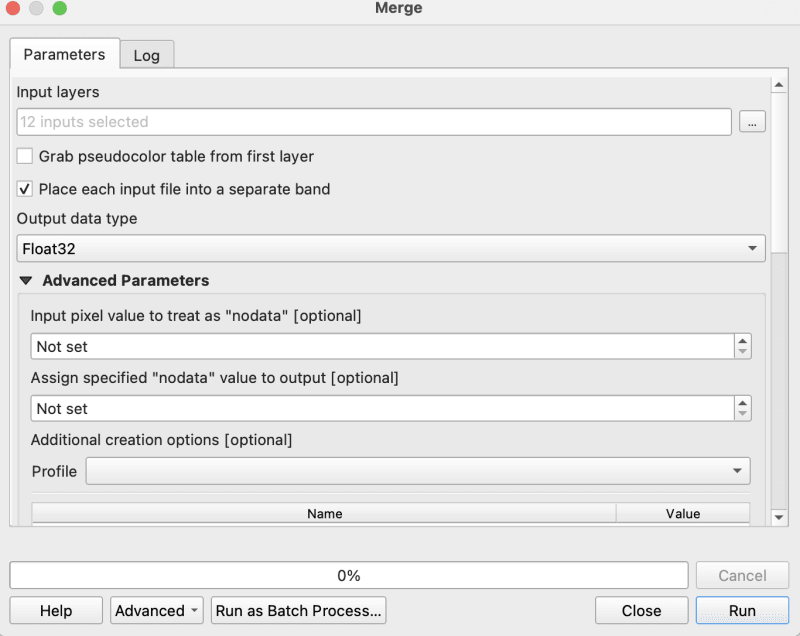
- 병합하는 동안 '각 입력 파일을 sep 밴드에 배치'를 확인해야 합니다.
- 이제 병합된 TIFF를 원시 Geotiff로 합성하여 내보냅니다.
가정
- 이미지가 WGS1984에 있는지 확인하세요. 우리의 경우 이미지는 이미 ws1984에 있으므로 변환이 필요하지 않습니다
- Nodata가 없는지 확인하세요. 그렇다면 0으로 채우세요.
gdalwarp -overwrite -dstnodata 0 "$input_file" "${output_file}_nodata.tif"
- 마지막으로 출력 이미지가 COG에 있는지 확인하세요.
gdal_translate -of COG "$input_file" "$output_file"
cog2h3 저장소에 제공된 bash 스크립트를 사용하여 이를 자동화하고 있습니다.
sudo bash pre.sh sentinel2_composite.tif
h3 세포의 과정과 생성
이제 마지막으로 전처리 스크립트를 완료했으므로 합성 톱니바퀴 이미지의 각 밴드에 대한 h3 셀을 계산해 보겠습니다.
- cog2h3 설치
pip install cog2h3
- 데이터베이스 자격 증명 내보내기
export DATABASE_URL="postgresql://user:password@host:port/database"
- 달리다
우리는 이 감시 이미지에 해상도 10을 사용하고 있지만 스크립트 자체에서도 h3 셀을 래스터의 가장 작은 픽셀보다 작게 만드는 래스터에 대한 최적의 해상도를 인쇄하는 것을 볼 수 있습니다.
cog2h3 --cog sentinel2_composite_preprocessed.tif --table sentinel --multiband --res 10
postgresql에서 결과를 계산하고 저장하는 데 1분 정도 걸렸습니다.
로그:
2024-08-24 08:39:43,233 - INFO - Starting processing
2024-08-24 08:39:43,234 - INFO - COG file already exists at sentinel2_composite_preprocessed.tif
2024-08-24 08:39:43,234 - INFO - Processing raster file: sentinel2_composite_preprocessed.tif
2024-08-24 08:39:43,864 - INFO - Determined Min fitting H3 resolution for band 1: 11
2024-08-24 08:39:43,865 - INFO - Resampling original raster to: 200.786148m
2024-08-24 08:39:44,037 - INFO - Resampling Done for band 1
2024-08-24 08:39:44,037 - INFO - New Native H3 resolution for band 1: 10
2024-08-24 08:39:44,738 - INFO - Calculation done for res:10 band:1
2024-08-24 08:39:44,749 - INFO - Determined Min fitting H3 resolution for band 2: 11
2024-08-24 08:39:44,749 - INFO - Resampling original raster to: 200.786148m
2024-08-24 08:39:44,757 - INFO - Resampling Done for band 2
2024-08-24 08:39:44,757 - INFO - New Native H3 resolution for band 2: 10
2024-08-24 08:39:45,359 - INFO - Calculation done for res:10 band:2
2024-08-24 08:39:45,366 - INFO - Determined Min fitting H3 resolution for band 3: 11
2024-08-24 08:39:45,366 - INFO - Resampling original raster to: 200.786148m
2024-08-24 08:39:45,374 - INFO - Resampling Done for band 3
2024-08-24 08:39:45,374 - INFO - New Native H3 resolution for band 3: 10
2024-08-24 08:39:45,986 - INFO - Calculation done for res:10 band:3
2024-08-24 08:39:45,994 - INFO - Determined Min fitting H3 resolution for band 4: 11
2024-08-24 08:39:45,994 - INFO - Resampling original raster to: 200.786148m
2024-08-24 08:39:46,003 - INFO - Resampling Done for band 4
2024-08-24 08:39:46,003 - INFO - New Native H3 resolution for band 4: 10
2024-08-24 08:39:46,605 - INFO - Calculation done for res:10 band:4
2024-08-24 08:39:46,612 - INFO - Determined Min fitting H3 resolution for band 5: 11
2024-08-24 08:39:46,612 - INFO - Resampling original raster to: 200.786148m
2024-08-24 08:39:46,619 - INFO - Resampling Done for band 5
2024-08-24 08:39:46,619 - INFO - New Native H3 resolution for band 5: 10
2024-08-24 08:39:47,223 - INFO - Calculation done for res:10 band:5
2024-08-24 08:39:47,230 - INFO - Determined Min fitting H3 resolution for band 6: 11
2024-08-24 08:39:47,230 - INFO - Resampling original raster to: 200.786148m
2024-08-24 08:39:47,239 - INFO - Resampling Done for band 6
2024-08-24 08:39:47,239 - INFO - New Native H3 resolution for band 6: 10
2024-08-24 08:39:47,829 - INFO - Calculation done for res:10 band:6
2024-08-24 08:39:47,837 - INFO - Determined Min fitting H3 resolution for band 7: 11
2024-08-24 08:39:47,837 - INFO - Resampling original raster to: 200.786148m
2024-08-24 08:39:47,845 - INFO - Resampling Done for band 7
2024-08-24 08:39:47,845 - INFO - New Native H3 resolution for band 7: 10
2024-08-24 08:39:48,445 - INFO - Calculation done for res:10 band:7
2024-08-24 08:39:48,453 - INFO - Determined Min fitting H3 resolution for band 8: 11
2024-08-24 08:39:48,453 - INFO - Resampling original raster to: 200.786148m
2024-08-24 08:39:48,461 - INFO - Resampling Done for band 8
2024-08-24 08:39:48,461 - INFO - New Native H3 resolution for band 8: 10
2024-08-24 08:39:49,046 - INFO - Calculation done for res:10 band:8
2024-08-24 08:39:49,054 - INFO - Determined Min fitting H3 resolution for band 9: 11
2024-08-24 08:39:49,054 - INFO - Resampling original raster to: 200.786148m
2024-08-24 08:39:49,062 - INFO - Resampling Done for band 9
2024-08-24 08:39:49,063 - INFO - New Native H3 resolution for band 9: 10
2024-08-24 08:39:49,647 - INFO - Calculation done for res:10 band:9
2024-08-24 08:39:51,435 - INFO - Converting H3 indices to hex strings
2024-08-24 08:39:51,906 - INFO - Overall raster calculation done in 8 seconds
2024-08-24 08:39:51,906 - INFO - Creating or replacing table sentinel in database
2024-08-24 08:40:03,153 - INFO - Table sentinel created or updated successfully in 11.25 seconds.
2024-08-24 08:40:03,360 - INFO - Processing completed
분석하다
이제 postgresql에 데이터가 있으므로 분석을 해보겠습니다.
- 처리한 밴드가 모두 있는지 확인합니다(밴드 1부터 9까지 처리했음을 기억하세요).
select *
from sentinel

- 각 셀에 대한 ndvi 계산
explain analyze
select h3_ix , (band8-band4)/(band8 band4) as ndvi
from public.sentinel
쿼리 계획:
QUERY PLAN                                                                                                       |
-----------------------------------------------------------------------------------------------------------------
Seq Scan on sentinel  (cost=0.00..28475.41 rows=923509 width=16) (actual time=0.014..155.049 rows=923509 loops=1)|
Planning Time: 0.080 ms                                                                                          |
Execution Time: 183.764 ms                                                                                       |
여기에서 볼 수 있듯이 해당 영역의 모든 행에 대해 계산이 즉시 이루어집니다. 이는 다른 모든 인덱스에도 적용되며, postgresql은 복잡한 쿼리 및 테이블 조인을 처리할 수 있으므로 h3_ix 기본 키를 사용하여 다른 테이블과 복잡한 인덱스 조인을 계산하고 여기서 의미 있는 결과를 도출할 수 있습니다.
시각화 및 검증
계산된 지수가 참인지 시각화하고 검증해 보겠습니다.
- 테이블 생성(QGIS에서 시각화용)
create table ndvi_sentinel
as(
select h3_ix , (band8-band4)/(band8 band4) as ndvi
from public.sentinel )
- h3 셀을 시각화하기 위해 형상을 추가해 보겠습니다. 이는 QGIS에서 시각화하는 데만 필요하며, 스스로 최소한의 API를 구축하는 경우 쿼리에서 직접 지오메트리를 구성할 수 있으므로 이것이 필요하지 않습니다.
ALTER TABLE ndvi_sentinel
ADD COLUMN geometry geometry(Polygon, 4326)
GENERATED ALWAYS AS (h3_cell_to_boundary_geometry(h3_ix)) STORED;
- 기하학에 대한 색인 생성
create index on ndvi_sentinel(geometry);
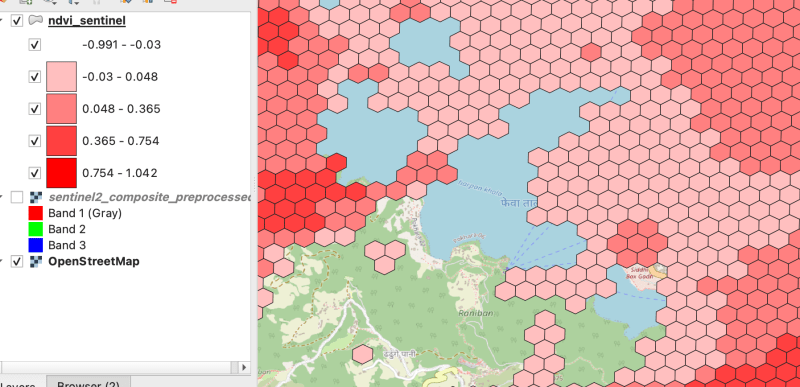
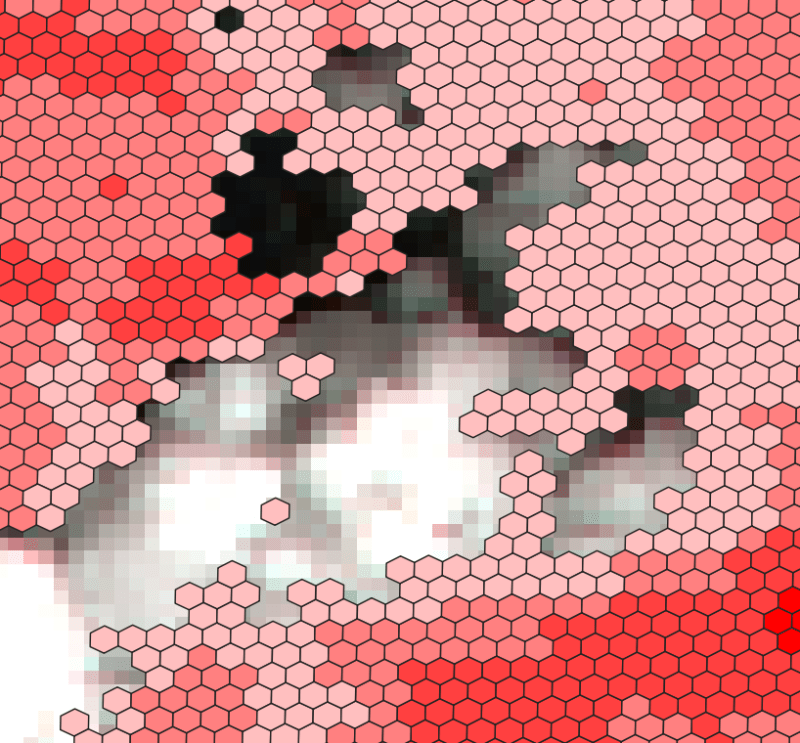
- QGIS에 데이터베이스를 연결하고 ndvi 값을 기반으로 테이블을 시각화합니다. 페와(Fewa) 호수나 구름 근처 지역을 알아봅시다
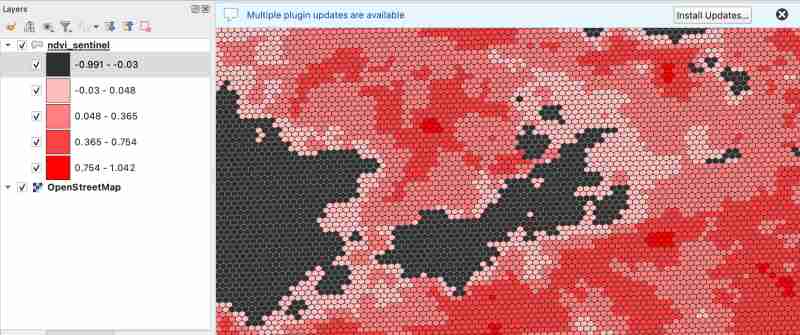
우리가 알고 있듯이 -1.0에서 0.1 사이의 값은 깊은 물이나 빽빽한 구름을 나타내야 합니다.
그것이 사실인지 확인해 보겠습니다(기본 이미지를 볼 수 있도록 첫 번째 카테고리를 투명하게 만듭니다).
- 구름 확인:
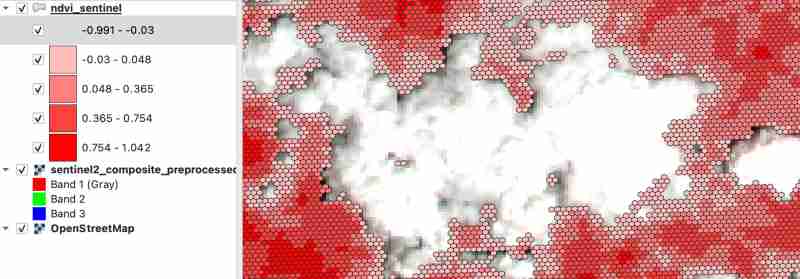
- 체크 레이크
호수 주변에 구름이 있었기 때문에 근처의 들판이 구름으로 덮여 있는 것이 당연합니다
읽어주셔서 감사합니다! 다음 블로그에서 뵙겠습니다
-
 HTML 서식 태그HTML 서식 요소 **HTML Formatting is a process of formatting text for better look and feel. HTML provides us ability to format text without...프로그램 작성 2025-07-02에 게시되었습니다
 -
 Spring Security 4.1 이상에서 CORS 문제를 해결하기위한 안내서Spring Security 4.1 이후 Cors 지원을 활성화하기위한보다 간단한 접근 방식이 있습니다. webmvcconfigureradapter { @override public void addcorsmappings (corsregistry Registry) {...프로그램 작성 2025-07-02에 게시되었습니다
 -
 PHP 배열 키-값 이상 : 07 및 08의 호기심 사례 이해이 문제는 PHP의 주요 제로 해석에서 비롯됩니다. 숫자가 0 (예 : 07 또는 08)으로 접두사를 넣으면 PHP는 소수점 값이 아닌 옥탈 값 (기본 8)으로 해석합니다. 설명 : echo 07; // 인쇄 7 (10 월 07 = 10 진수 7) ...프로그램 작성 2025-07-02에 게시되었습니다
 -
 팬더에서 연도와 1/4 열을 하나의주기적인 열로 병합하는 방법은 무엇입니까?새로운 기간 열에 대한 열을 연결하는 열 문제 문 : 라는 열이있는 pandas dataframe을 고려하십시오 : 분기 2000 Q2 2001 Q3 목표는 다음과 같은 결과를 얻기 위해 "연도"...프로그램 작성 2025-07-02에 게시되었습니다
 -
 McRypt에서 OpenSSL로 암호화를 마이그레이션하고 OpenSSL을 사용하여 McRypt 암호화 데이터를 해제 할 수 있습니까?질문 : McRypt에서 OpenSSL로 내 암호화 라이브러리를 업그레이드 할 수 있습니까? 그렇다면 어떻게? 대답 : 대답 : 예, McRypt에서 암호화 라이브러리를 OpenSSL로 업그레이드 할 수 있습니다. OpenSSL을 사용하여 McRyp...프로그램 작성 2025-07-02에 게시되었습니다
 -
 교체 지시문을 사용하여 GO MOD에서 모듈 경로 불일치를 해결하는 방법은 무엇입니까?[ github.com/coreos/coreos/client github.com/coreos/etcd/client.test imports github.com/coreos/etcd/integration에 의해 테스트 된 Echoed 메시지에 의해 입증 된 바와...프로그램 작성 2025-07-02에 게시되었습니다
 -
 PYTZ가 처음에 예상치 못한 시간대 오프셋을 표시하는 이유는 무엇입니까?import pytz pytz.timezone ( 'Asia/Hong_kong') std> discrepancy source 역사 전반에 걸쳐 변동합니다. PYTZ가 제공하는 기본 시간대 이름 및 오프...프로그램 작성 2025-07-02에 게시되었습니다
 -
 MySQL 오류 #1089 : 잘못된 접두사 키를 얻는 이유는 무엇입니까?오류 설명 [#1089- 잘못된 접두사 키 "는 테이블에서 열에 프리픽스 키를 만들려고 시도 할 때 나타날 수 있습니다. 접두사 키는 특정 접두사 길이의 문자열 열 길이를 색인화하도록 설계되었으며, 접두사를 더 빠르게 검색 할 수 있습니...프로그램 작성 2025-07-02에 게시되었습니다
 -
 열의 열이 다른 데이터베이스 테이블을 어떻게 통합하려면 어떻게해야합니까?다른 열이있는 결합 테이블 ] 는 데이터베이스 테이블을 다른 열로 병합하려고 할 때 도전에 직면 할 수 있습니다. 간단한 방법은 열이 적은 테이블의 누락 된 열에 null 값을 추가하는 것입니다. 예를 들어, 표 B보다 더 많은 열이있는 두 개의 테이블,...프로그램 작성 2025-07-02에 게시되었습니다
 -
 SQLALCHEMY 필터 조항에서 'Flake8'플래킹 부울 비교가 된 이유는 무엇입니까?데이터베이스 테이블의 부울 필드 (Obsoleted)는 비 초소형 테스트 사례의 수를 결정하는 데 사용됩니다. 이 코드는 필터 절에서 테스트 케이스를 사용합니다. casenum = session.query (testcase) .filter (testcas...프로그램 작성 2025-07-02에 게시되었습니다
 -
 동적 인 크기의 부모 요소 내에서 요소의 스크롤 범위를 제한하는 방법은 무엇입니까?문제 : 고정 된 사이드 바로 조정을 유지하면서 사용자의 수직 스크롤과 함께 이동하는 스크롤 가능한 맵 디브가있는 레이아웃을 고려합니다. 그러나 맵의 스크롤은 뷰포트의 높이를 초과하여 사용자가 페이지 바닥 글에 액세스하는 것을 방지합니다. ...프로그램 작성 2025-07-02에 게시되었습니다
 -
 PHP \의 기능 재정의 제한을 극복하는 방법은 무엇입니까?return $ a * $ b; } 그러나 PHP 도구 벨트에는 숨겨진 보석이 있습니다. runkit_function_rename () runkit_function_rename ( 'this', 'that'); run...프로그램 작성 2025-07-02에 게시되었습니다
 -
 오른쪽 테이블의 where 조항에서 필터링 할 때 왼쪽 결합이 연결된 이유는 무엇입니까?다음 쿼리를 상상해보십시오 : select A.Foo, B. 바, c.foobar a로 테이블온에서 내부는 a.pk = b.fk에서 b로 tabletwo를 결합합니다 b.pk = c.fk에서 c as c로 왼쪽으로 결합하십시오 여기서 a.foo = '...프로그램 작성 2025-07-02에 게시되었습니다
 -
 Google API에서 최신 JQuery 라이브러리를 검색하는 방법은 무엇입니까?https://code.jquery.com/jquery-latest.min.js (jQuery Hosted, Minified) https://code.jquery.com/jquery-latest.js (JQuery Hosted, Hosted, 비 압축) 압축...프로그램 작성 2025-07-02에 게시되었습니다
 -
 오른쪽에서 CSS 배경 이미지를 찾는 방법은 무엇입니까?/ 오른쪽에서 10px 요소를 배치하려면 / 배경 위치 : 오른쪽 10px 상단; 이 CSS 상단 코너는 오른쪽 상단의 왼쪽에서 10 pixels가되어야합니다. 요소의 상단 에지. 이 기능은 Internet Explorer 8 또는 이...프로그램 작성 2025-07-02에 게시되었습니다
중국어 공부
- 1 "걷다"를 중국어로 어떻게 말하나요? 走路 중국어 발음, 走路 중국어 학습
- 2 "비행기를 타다"를 중국어로 어떻게 말하나요? 坐飞机 중국어 발음, 坐飞机 중국어 학습
- 3 "기차를 타다"를 중국어로 어떻게 말하나요? 坐火车 중국어 발음, 坐火车 중국어 학습
- 4 "버스를 타다"를 중국어로 어떻게 말하나요? 坐车 중국어 발음, 坐车 중국어 학습
- 5 운전을 중국어로 어떻게 말하나요? 开车 중국어 발음, 开车 중국어 학습
- 6 수영을 중국어로 뭐라고 하나요? 游泳 중국어 발음, 游泳 중국어 학습
- 7 자전거를 타다 중국어로 뭐라고 하나요? 骑自行车 중국어 발음, 骑自行车 중국어 학습
- 8 중국어로 안녕하세요를 어떻게 말해요? 你好중국어 발음, 你好중국어 학습
- 9 감사합니다를 중국어로 어떻게 말하나요? 谢谢중국어 발음, 谢谢중국어 학습
- 10 How to say goodbye in Chinese? 再见Chinese pronunciation, 再见Chinese learning


