マルチバンド ラスターを処理 (Sentinel-hndex を使用してインデックスを作成)
こんにちは。前のブログでは、単一バンド ラスターに対して h3 インデックスと postgresql を使用してラスター解析を行う方法について説明しました。このブログでは、マルチバンド ラスターを処理し、インデックスを簡単に作成する方法について説明します。 Sentinel-2 画像を使用し、処理された h3 細胞から NDVI を作成し、結果を視覚化します
センチネル 2 データをダウンロードする
ネパール地域ポカラの https://apps.sentinel-hub.com/eo-browser/ からセンチネル 2 データをダウンロードしています。 NDVI の結果を検証します
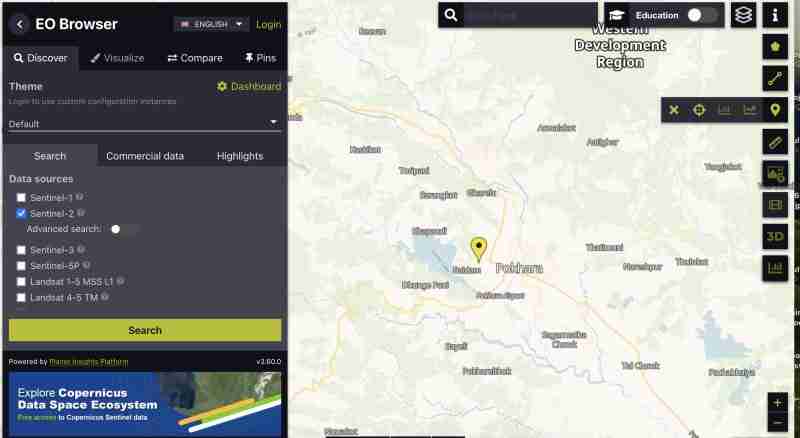
すべてのバンドのセンチネル画像をダウンロードするには:
- アカウントを作成する必要があります
- お住まいの地域で画像を見つけて、興味のある地域をカバーするグリッドを選択してください
- グリッドにズームし、右の垂直バーの
 アイコンをクリックします
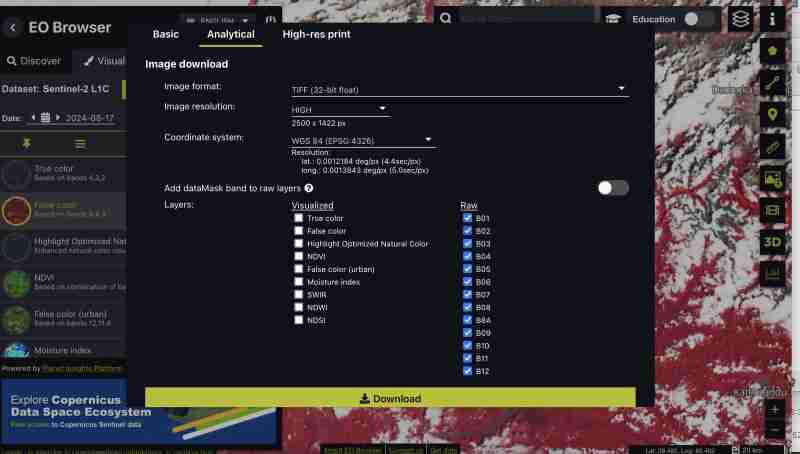
 - その後、分析タブに移動し、画像形式が tiff 32 ビット、高解像度、wgs1984 形式のすべてのバンドを選択し、すべてのバンドがチェックされています
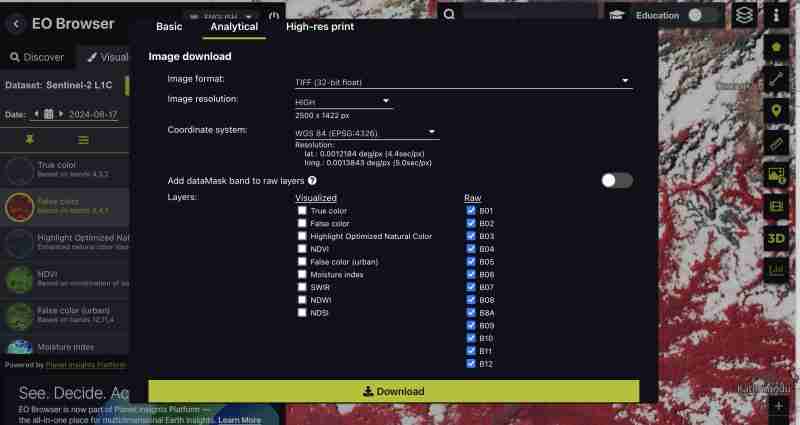
必要に応じて、NDVI、フォールスカラー tiff のみ、または特定のバンドなど、事前に生成されたインデックスをダウンロードすることもできます。自分たちで処理したいので、すべてのバンドをダウンロードしています
- ダウンロードをクリック
前処理
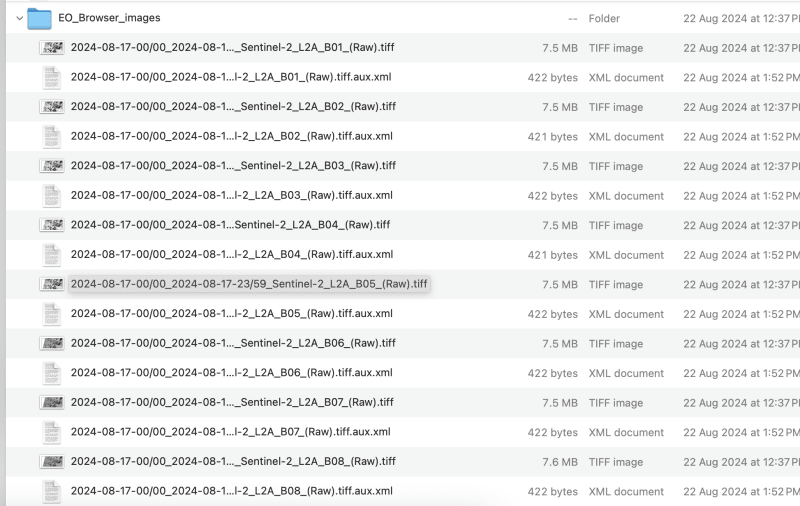
生の形式をダウンロードしたため、すべてのバンドをセンチネルから別の tiff として取得します
- 合成画像を作成しましょう:
これは、GIS ツールまたは gdal を通じて実行できます
- gdal_merge の使用:
ファイル名にスラッシュが含まれないように、ダウンロードしたファイルの名前を次のように Band1,band2 に変更する必要があります
この演習ではバンド 9 まで処理しましょう。必要に応じてバンドを選択できます
gdal_merge.py -separate -o sentinel2_composite.tif band1.tif band2.tif band3.tif band4.tif band5.tif band6.tif band7.tif band8.tif band9.tif
- QGIS の使用 :
- すべての個々のバンドを QGIS にロードします
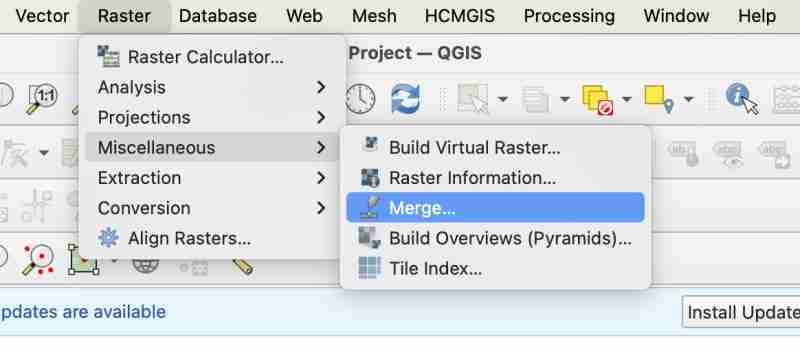
- ラスター > その他 > マージに移動します
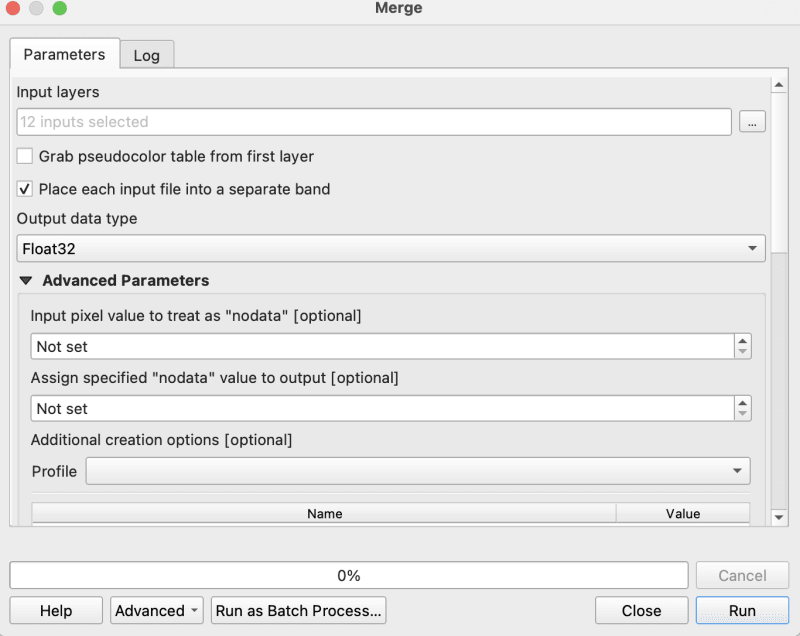
- マージ中に「各入力ファイルを sep バンドに配置する」にチェックを入れる必要があります
- マージされた tiff を合成として生の geotiff にエクスポートします
ハウスキーピング
- 画像が WGS1984 にあることを確認してください 私たちの場合、画像はすでに ws1984 にあるため、変換の必要はありません
- nodata がないことを確認してください。はいの場合は 0 を入力してください
gdalwarp -overwrite -dstnodata 0 "$input_file" "${output_file}_nodata.tif"
- 最後に、出力イメージが COG であることを確認します
gdal_translate -of COG "$input_file" "$output_file"
これらを自動化するために、cog2h3 リポジトリで提供されている bash スクリプトを使用しています
sudo bash pre.sh sentinel2_composite.tif
h3 セルのプロセスと作成
前処理スクリプトが完了したので、いよいよ合成歯車画像の各バンドの h3 セルの計算に進みましょう
- cog2h3 をインストールする
pip install cog2h3
- データベース認証情報をエクスポートします
export DATABASE_URL="postgresql://user:password@host:port/database"
- 走る
このセンチネル画像には解像度 10 を使用していますが、h3 セルをラスター内の最小ピクセルよりも小さくする、ラスターに最適な解像度を印刷するスクリプト自体にも表示されます。
cog2h3 --cog sentinel2_composite_preprocessed.tif --table sentinel --multiband --res 10
結果を計算して postgresql に保存するのに 1 分かかりました
ログ:
2024-08-24 08:39:43,233 - INFO - Starting processing
2024-08-24 08:39:43,234 - INFO - COG file already exists at sentinel2_composite_preprocessed.tif
2024-08-24 08:39:43,234 - INFO - Processing raster file: sentinel2_composite_preprocessed.tif
2024-08-24 08:39:43,864 - INFO - Determined Min fitting H3 resolution for band 1: 11
2024-08-24 08:39:43,865 - INFO - Resampling original raster to: 200.786148m
2024-08-24 08:39:44,037 - INFO - Resampling Done for band 1
2024-08-24 08:39:44,037 - INFO - New Native H3 resolution for band 1: 10
2024-08-24 08:39:44,738 - INFO - Calculation done for res:10 band:1
2024-08-24 08:39:44,749 - INFO - Determined Min fitting H3 resolution for band 2: 11
2024-08-24 08:39:44,749 - INFO - Resampling original raster to: 200.786148m
2024-08-24 08:39:44,757 - INFO - Resampling Done for band 2
2024-08-24 08:39:44,757 - INFO - New Native H3 resolution for band 2: 10
2024-08-24 08:39:45,359 - INFO - Calculation done for res:10 band:2
2024-08-24 08:39:45,366 - INFO - Determined Min fitting H3 resolution for band 3: 11
2024-08-24 08:39:45,366 - INFO - Resampling original raster to: 200.786148m
2024-08-24 08:39:45,374 - INFO - Resampling Done for band 3
2024-08-24 08:39:45,374 - INFO - New Native H3 resolution for band 3: 10
2024-08-24 08:39:45,986 - INFO - Calculation done for res:10 band:3
2024-08-24 08:39:45,994 - INFO - Determined Min fitting H3 resolution for band 4: 11
2024-08-24 08:39:45,994 - INFO - Resampling original raster to: 200.786148m
2024-08-24 08:39:46,003 - INFO - Resampling Done for band 4
2024-08-24 08:39:46,003 - INFO - New Native H3 resolution for band 4: 10
2024-08-24 08:39:46,605 - INFO - Calculation done for res:10 band:4
2024-08-24 08:39:46,612 - INFO - Determined Min fitting H3 resolution for band 5: 11
2024-08-24 08:39:46,612 - INFO - Resampling original raster to: 200.786148m
2024-08-24 08:39:46,619 - INFO - Resampling Done for band 5
2024-08-24 08:39:46,619 - INFO - New Native H3 resolution for band 5: 10
2024-08-24 08:39:47,223 - INFO - Calculation done for res:10 band:5
2024-08-24 08:39:47,230 - INFO - Determined Min fitting H3 resolution for band 6: 11
2024-08-24 08:39:47,230 - INFO - Resampling original raster to: 200.786148m
2024-08-24 08:39:47,239 - INFO - Resampling Done for band 6
2024-08-24 08:39:47,239 - INFO - New Native H3 resolution for band 6: 10
2024-08-24 08:39:47,829 - INFO - Calculation done for res:10 band:6
2024-08-24 08:39:47,837 - INFO - Determined Min fitting H3 resolution for band 7: 11
2024-08-24 08:39:47,837 - INFO - Resampling original raster to: 200.786148m
2024-08-24 08:39:47,845 - INFO - Resampling Done for band 7
2024-08-24 08:39:47,845 - INFO - New Native H3 resolution for band 7: 10
2024-08-24 08:39:48,445 - INFO - Calculation done for res:10 band:7
2024-08-24 08:39:48,453 - INFO - Determined Min fitting H3 resolution for band 8: 11
2024-08-24 08:39:48,453 - INFO - Resampling original raster to: 200.786148m
2024-08-24 08:39:48,461 - INFO - Resampling Done for band 8
2024-08-24 08:39:48,461 - INFO - New Native H3 resolution for band 8: 10
2024-08-24 08:39:49,046 - INFO - Calculation done for res:10 band:8
2024-08-24 08:39:49,054 - INFO - Determined Min fitting H3 resolution for band 9: 11
2024-08-24 08:39:49,054 - INFO - Resampling original raster to: 200.786148m
2024-08-24 08:39:49,062 - INFO - Resampling Done for band 9
2024-08-24 08:39:49,063 - INFO - New Native H3 resolution for band 9: 10
2024-08-24 08:39:49,647 - INFO - Calculation done for res:10 band:9
2024-08-24 08:39:51,435 - INFO - Converting H3 indices to hex strings
2024-08-24 08:39:51,906 - INFO - Overall raster calculation done in 8 seconds
2024-08-24 08:39:51,906 - INFO - Creating or replacing table sentinel in database
2024-08-24 08:40:03,153 - INFO - Table sentinel created or updated successfully in 11.25 seconds.
2024-08-24 08:40:03,360 - INFO - Processing completed
分析する
postgresql にデータがあるので、分析してみましょう
- 処理したすべてのバンドがあることを確認します (バンド 1 から 9 まで処理したことを思い出してください)
select *
from sentinel

- 各セルの ndvi を計算します
explain analyze
select h3_ix , (band8-band4)/(band8 band4) as ndvi
from public.sentinel
クエリプラン:
QUERY PLAN                                                                                                       |
-----------------------------------------------------------------------------------------------------------------
Seq Scan on sentinel  (cost=0.00..28475.41 rows=923509 width=16) (actual time=0.014..155.049 rows=923509 loops=1)|
Planning Time: 0.080 ms                                                                                          |
Execution Time: 183.764 ms                                                                                       |
ここでわかるように、その領域のすべての行の計算は瞬時に行われます。これは他のすべてのインデックスに当てはまり、postgresql は複雑なクエリとテーブル結合を処理できるため、h3_ix 主キーを使用して他のテーブルと結合する複雑なインデックスを計算し、心配することなくそこから意味のある結果を導き出すことができます。
見える化と検証
計算されたインデックスが正しいかどうかを視覚化して検証してみましょう
- テーブルの作成 (QGIS で視覚化するため)
create table ndvi_sentinel
as(
select h3_ix , (band8-band4)/(band8 band4) as ndvi
from public.sentinel )
- h3 セルを視覚化するためにジオメトリを追加しましょう これは QGIS で視覚化する場合にのみ必要です。最小限の API を自分で構築する場合は、クエリから直接ジオメトリを構築できるため、これは必要ありません。
ALTER TABLE ndvi_sentinel
ADD COLUMN geometry geometry(Polygon, 4326)
GENERATED ALWAYS AS (h3_cell_to_boundary_geometry(h3_ix)) STORED;
- ジオメトリにインデックスを作成
create index on ndvi_sentinel(geometry);
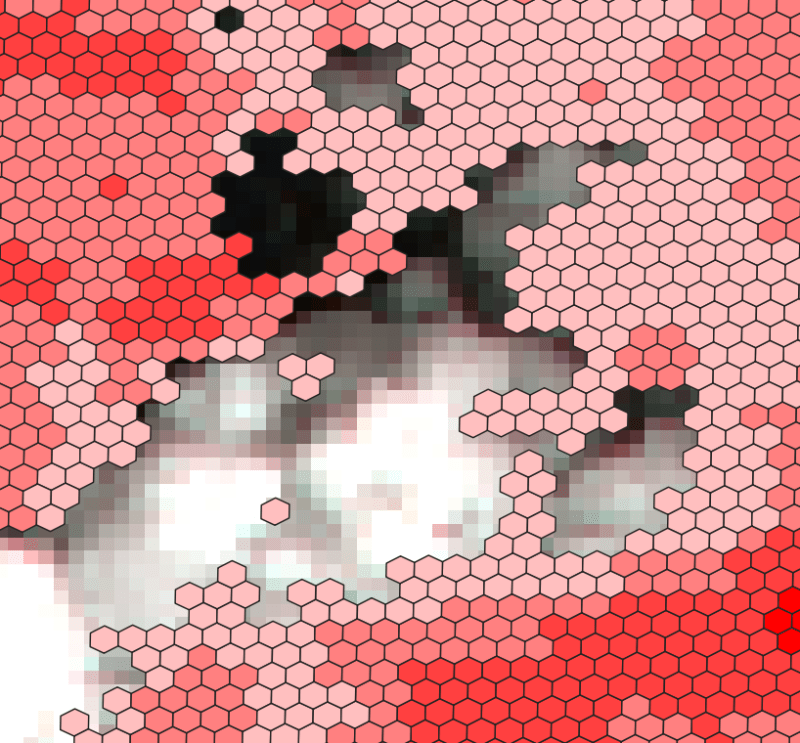
- QGIS でデータベースを接続し、ndvi 値に基づいてテーブルを視覚化します ペワ湖または雲の近くのエリアを取得しましょう
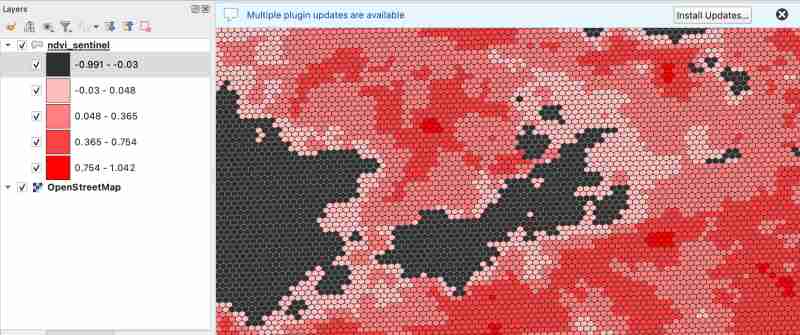
ご存知のとおり、-1.0 ~ 0.1 の値は深海または濃い雲を表すはずです
それが本当かどうか見てみましょう(最初のカテゴリを透明にして、下にある画像が見えるようにします)
- 雲をチェック :
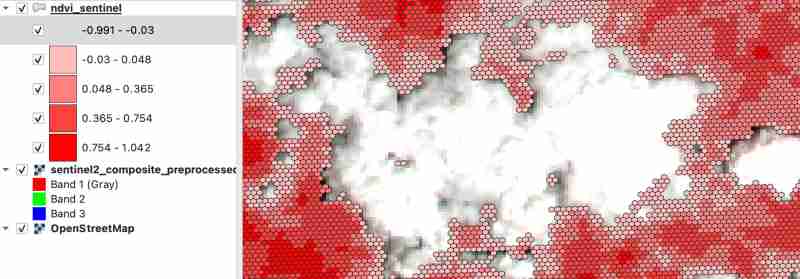
- チェックレイク
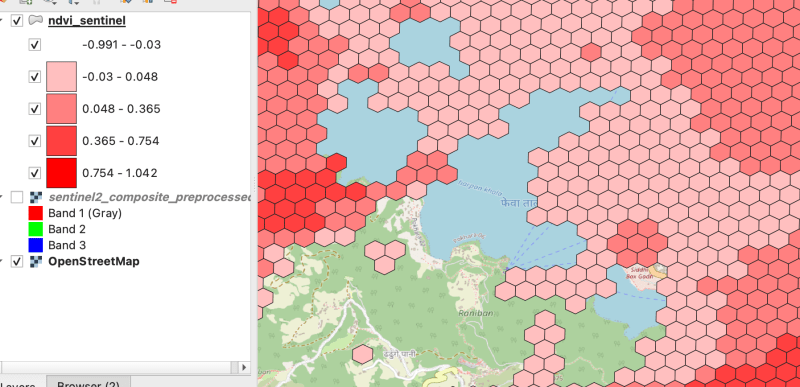
湖の周りに雲があったので、近くの畑が雲に覆われているのは当然です
読んでいただきありがとうございます!次のブログでお会いしましょう
-
 バージョン5.6.5の前にMySQLのタイムスタンプ列を使用してcurrent_timestampを使用することの制限は何でしたか?の制限current_timestampがデフォルトまたは5.6.5より前のmysqlバージョンのcurrent_timestampの更新条項の制限 は歴史的に、5.6.5以前のmysqlバージョンでは、デフォルトの列のみを制限しました。 current_timestamp句。この制限は、20...プログラミング 2025-07-09に投稿しました
 -
 UTF8 MySQLテーブルでLATIN1文字をUTF8に正しく変換する方法latin1文字をUTF8テーブル内のutf8に変換する diaCriticsのキャラクターが遭遇した問題に遭遇しました( "Jáuòiñe")がUTF8テーブルで存在していないために、utf8テーブルが不足しているために存在していませんでした。 「mysql_se...プログラミング 2025-07-09に投稿しました
 -
 顔を検出するための原因とソリューション:エラー-215エラー処理: "エラー:(-215)!empty()in function detectectmultiscale" in opencv の解決済みの誤報を検出しようとする場合、 "関数DetectMultiscale。」このエラーは、通常、顔の検出のため...プログラミング 2025-07-09に投稿しました
 -
 偽のウェイクアップは本当にJavaで起こりますか?Javaの偽りの目覚め:現実か神話ですか?そのような動作の可能性は存在しますが、問題は残ります:それらは実際に実際に発生しますか?プロセスが信号を受信すると、EINTRで突然戻ってきて、ブロッキングシステムの呼び出しを早期に終了させる可能性があります。その結果、POSIX信号はスプリアスウェ...プログラミング 2025-07-09に投稿しました
 -
 さまざまな数の列を持つデータベーステーブルを結合するにはどうすればよいですか?異なる列とのテーブルを組み合わせた ] は、データベーステーブルを異なる列とマージしようとする場合に課題に遭遇する可能性があります。簡単な方法は、列が少ないテーブルに欠落している列にnull値を追加することです。 たとえば、テーブルAと表Bの2つの表Aと表AがテーブルBよりも多くの列がある...プログラミング 2025-07-09に投稿しました
 -
 PHPを使用してXMLファイルから属性値を効率的に取得するにはどうすればよいですか?XMLファイルから属性値をPHP の取得します。提供されている例のような属性を含むXMLファイルを使用する場合: $xml = simplexml_load_file($file); foreach ($xml->Var[0]->attributes() as $att...プログラミング 2025-07-09に投稿しました
 -
 Python読み取りCSVファイルUnicodedeCodeError究極のソリューションunicode decodeエラーがcsvファイルreading 内蔵csvモジュールを使用してpythonにcsvファイルを読み込もうとする場合、エラーが発生する可能性があります: SyntaxError: (unicode error) 'unicodeescape' codec ...プログラミング 2025-07-09に投稿しました
 -
 mysqlが絵文字を挿入するときに\\ "string値エラー\\"例外を解きます誤った文字列値例外を解決する絵文字を挿入するときに絵文字を含む文字列をMySQLデータベースに挿入しようとするときに、次の例外を遭遇する可能性があります: Java.SQL.SQL.SQL.SQL.SQL.SQL.SQL.SQL.SQL.SQL.SQL.SQL.SQL.SQL.SQL.SQL...プログラミング 2025-07-09に投稿しました
 -
 Java文字列に複数のサブストリングを効率的に交換するにはどうすればよいですか?java で複数のサブストリングを弦の複数のサブストリングを置き換えると、文字列内の複数のサブストリングを置き換える必要性に直面すると、弦楽列の方法を繰り返し担当するブルートのアプローチに頼ることに魅力的です。ただし、これは大きな文字列や多数の文字列を使用する場合は非効率的です。正規表...プログラミング 2025-07-09に投稿しました
 -
 フォームリフレッシュ後に重複した提出を防ぐ方法は?を更新することで重複した提出を防ぐ Web開発で、フォームの提出後にページが更新された場合に重複した提出の問題に遭遇することが一般的です。これに対処するには、次のアプローチを検討してください。 if(isset($ _ post ['name'])){ ...プログラミング 2025-07-09に投稿しました
 -
 セル編集後にカスタムJTableセルレンダリングを維持するにはどうすればよいですか?セル編集後のjtableセルレンダリングの維持 は、カスタムセルのレンダリングと編集機能を実装することでユーザーエクスペリエンスを向上させることができます。ただし、操作を編集した後でも目的のフォーマットが保存されることを保証することが重要です。このようなシナリオでは、編集がコミットされた後...プログラミング 2025-07-09に投稿しました
 -
 CSS「コンテンツ」プロパティを使用してFirefoxが画像を表示しないのはなぜですか?firefox のコンテンツURLを使用して画像を表示します。これは、提供されたCSSクラスで見ることができます: .googlePic { content: url('../../img/googlePlusIcon.PNG'); margin-top: -6.5%;...プログラミング 2025-07-09に投稿しました
 -
 Pythonを使用して、大きなファイルを逆の順序で効率的に読み取るにはどうすればよいですか?Python でファイルを逆順序で読み取る必要があり、最後の行から最初の行までの内容を読み取る必要がある場合、Pythonの組み込み機能は適切ではないかもしれません。このタスクに取り組むための効率的なソリューションは次のとおりです。バッファベースのアプローチを使用してパフォーマンスを最...プログラミング 2025-07-09に投稿しました
 -
 McRyptからOpenSSLに暗号化を移行し、OpenSSLを使用してMcRyptで暗号化されたデータを復号化できますか?暗号化ライブラリをMcRyptからOpenSSL にアップグレードして、暗号化ライブラリをMcRyptからOpenSLにアップグレードできますか? OpenSSLでは、McRyptで暗号化されたデータを復号化することは可能ですか? 2つの異なる投稿は矛盾する情報を提供します。もしそうなら...プログラミング 2025-07-09に投稿しました
中国語を勉強する
- 1 「歩く」は中国語で何と言いますか? 走路 中国語の発音、走路 中国語学習
- 2 「飛行機に乗る」は中国語で何と言いますか? 坐飞机 中国語の発音、坐飞机 中国語学習
- 3 「電車に乗る」は中国語で何と言いますか? 坐火车 中国語の発音、坐火车 中国語学習
- 4 「バスに乗る」は中国語で何と言いますか? 坐车 中国語の発音、坐车 中国語学習
- 5 中国語でドライブは何と言うでしょう? 开车 中国語の発音、开车 中国語学習
- 6 水泳は中国語で何と言うでしょう? 游泳 中国語の発音、游泳 中国語学習
- 7 中国語で自転車に乗るってなんて言うの? 骑自行车 中国語の発音、骑自行车 中国語学習
- 8 中国語で挨拶はなんて言うの? 你好中国語の発音、你好中国語学習
- 9 中国語でありがとうってなんて言うの? 谢谢中国語の発音、谢谢中国語学習
- 10 How to say goodbye in Chinese? 再见Chinese pronunciation, 再见Chinese learning


