Grafana Opentelemetry Starter
Grafana Hotel LGTM
I want to view server logs and traces with Grafana, but when I look for them, they all tell me to just set up a configuration file and launch a node in Kubernates, so there is a starter for people who don't feel like giving up.
grafana-otel-lgtm allows you to easily launch Loki, Grafana, Tempo, and Mimir locally without any configuration.
Overview of Grafana Otel LGTM
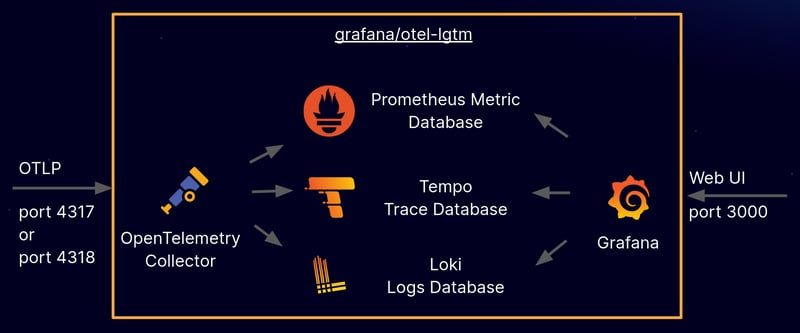
The grafana/otel-lgtm Docker image comes with OpenTelemetry Collector, Prometheus, Loki, Tempo, and Grafana preset as default settings.
It is easy to understand if you look at the picture below.

Flow as seen in the picture
1
The application sends it to port 4317 (grpc) or 4318 (http) using the OTLP protocol.
2
The Opentelemetry Collector is listening to the port, collects it, and transmits it to Prometheus for Metric, Loki for Log, and Tempo for Trace depending on the type of signal.
3
Prometheus, Loki, and Tempo store signals in their respective storage.
4
Connect to Grafana at localhost:3000 and visualize the accumulated data through queries.
How to set up
It is simple to key locally.
1. Pull docker image
docker pull grafana/otel-lgtm
2. Run run script
Write and run the run-lgtm.sh script.
#!/bin/bash

RELEASE=${1:-latest}

docker run \
  --name lgtm \
  -p 3000:3000 \
  -p 4317:4317 \
  -p 4318:4318 \
  --rm \
  -ti \
  -v $PWD/container/grafana:/data/grafana \
  -v $PWD/container/prometheus:/data/prometheus \
  -v $PWD/container/loki:/loki \
  -e GF_PATHS_DATA=/data/grafana \
  docker.io/grafana/otel-lgtm:${RELEASE}
execution result
sh run-lgtm.sh
WARNING: The requested image's platform (linux/amd64) does not match the detected host platform (linux/arm64/v8) and no specific platform was requested
Waiting for the OpenTelemetry collector and the Grafana LGTM stack to start up...
When I run it on an Apple silicon MacBook, the warning above appears, but it doesn't really matter since I'm using it locally for testing.
Docker execution screen

(You can check that ports 3000, 4317, and 4318 are open)
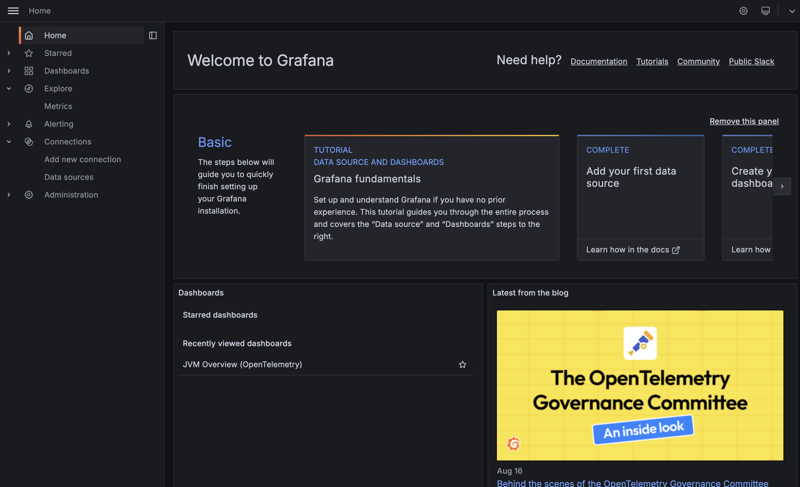
Grafana login screen
Let’s connect to localhost:3000.
You can log in as admin/admin.

-
 Why Am I Getting a \"Class \'ZipArchive\' Not Found\" Error After Installing Archive_Zip on My Linux Server?Class 'ZipArchive' Not Found Error While Installing Archive_Zip on Linux ServerSymptom:When attempting to run a script that utilizes the ZipAr...Programming Posted on 2025-07-17
 -
 How to upload files with additional parameters using java.net.URLConnection and multipart/form-data encoding?Uploading Files with HTTP RequestsTo upload files to an HTTP server while also submitting additional parameters, java.net.URLConnection and multipart/...Programming Posted on 2025-07-17
 -
 How to dynamically discover export package types in Go language?Finding Exported Package Types DynamicallyIn contrast to the limited type discovery capabilities in the reflect package, this article explores alterna...Programming Posted on 2025-07-17
 -
 Python efficient way to remove HTML tags from textStripping HTML Tags in Python for a Pristine Textual RepresentationManipulating HTML responses often involves extracting relevant text content while e...Programming Posted on 2025-07-17
 -
 Method to correctly convert Latin1 characters to UTF8 in UTF8 MySQL tableConvert Latin1 Characters in a UTF8 Table to UTF8You've encountered an issue where characters with diacritics (e.g., "Jáuò Iñe") were in...Programming Posted on 2025-07-17
 -
 How to Efficiently Convert Timezones in PHP?Efficient Timezone Conversion in PHPIn PHP, handling timezones can be a straightforward task. This guide will provide an easy-to-implement method for ...Programming Posted on 2025-07-17
 -
 How to Fix \"mysql_config not found\" Error When Installing MySQL-python on Ubuntu/Linux?MySQL-python Installation Error: "mysql_config not found"Attempting to install MySQL-python on Ubuntu/Linux Box may encounter an error messa...Programming Posted on 2025-07-17
 -
 FastAPI Custom 404 Page Creation GuideCustom 404 Not Found Page with FastAPITo create a custom 404 Not Found page, FastAPI offers several approaches. The appropriate method depends on your...Programming Posted on 2025-07-17
 -
 How do Java's Map.Entry and SimpleEntry simplify key-value pair management?A Comprehensive Collection for Value Pairs: Introducing Java's Map.Entry and SimpleEntryIn Java, when defining a collection where each element com...Programming Posted on 2025-07-17
 -
 How to Create a Smooth Left-Right CSS Animation for a Div Within Its Container?Generic CSS Animation for Left-Right MovementIn this article, we'll explore creating a generic CSS animation to move a div left and right, reachin...Programming Posted on 2025-07-17
 -
 Solve the \\"String value error\\" exception when MySQL inserts EmojiResolving Incorrect String Value Exception When Inserting EmojiWhen attempting to insert a string containing emoji characters into a MySQL database us...Programming Posted on 2025-07-17
 -
 Why can't Java create generic arrays?Generic Array Creation ErrorQuestion:When attempting to create an array of generic classes using an expression like:public static ArrayList<myObjec...Programming Posted on 2025-07-17
 -
 PHP SimpleXML parsing XML method with namespace colonParsing XML with Namespace Colons in PHPSimpleXML encounters difficulties when parsing XML containing tags with colons, such as XML elements with pref...Programming Posted on 2025-07-17
 -
 Python Read CSV File UnicodeDecodeError Ultimate SolutionUnicode Decode Error in CSV File ReadingWhen attempting to read a CSV file into Python using the built-in csv module, you may encounter an error stati...Programming Posted on 2025-07-17
 -
 User local time format and time zone offset display guideDisplaying Date/Time in User's Locale Format with Time OffsetWhen presenting dates and times to end-users, it's crucial to display them in the...Programming Posted on 2025-07-17
Study Chinese
- 1 How do you say "walk" in Chinese? 走路 Chinese pronunciation, 走路 Chinese learning
- 2 How do you say "take a plane" in Chinese? 坐飞机 Chinese pronunciation, 坐飞机 Chinese learning
- 3 How do you say "take a train" in Chinese? 坐火车 Chinese pronunciation, 坐火车 Chinese learning
- 4 How do you say "take a bus" in Chinese? 坐车 Chinese pronunciation, 坐车 Chinese learning
- 5 How to say drive in Chinese? 开车 Chinese pronunciation, 开车 Chinese learning
- 6 How do you say swimming in Chinese? 游泳 Chinese pronunciation, 游泳 Chinese learning
- 7 How do you say ride a bicycle in Chinese? 骑自行车 Chinese pronunciation, 骑自行车 Chinese learning
- 8 How do you say hello in Chinese? 你好Chinese pronunciation, 你好Chinese learning
- 9 How do you say thank you in Chinese? 谢谢Chinese pronunciation, 谢谢Chinese learning
- 10 How to say goodbye in Chinese? 再见Chinese pronunciation, 再见Chinese learning


