 Front page > Programming > Golang: How Observability and Profiling Revealed Nearly Undetectable Throttling
Golang: How Observability and Profiling Revealed Nearly Undetectable Throttling
 Browse:507
In a personal project with Go, which obtains information on financial assets from Bovespa.
The system makes intense use of concurrency and parallelism with goroutines, updating asset information (along with business calculations) every 8 seconds.
Initially, no errors or warnings appeared, but I noticed that some goroutines were taking longer than others to execute.
To be more specific, while the p99 time was at 0.03 ms, at some points, it increased to 0.9 ms. This led me to investigate the problem further.
I discovered that I was using a semaphore goroutine pool, which was created based on the GOMAXPROCS variable.
However, I realized there was a problem with this approach.
When we use the GOMAXPROCS variable, it does not correctly capture the number of cores available in the container. If the container has fewer available cores than the VM's total, it considers the VM's total. For example, my VM has 8 cores available, but the container only had 4. This resulted in 8 goroutines being created to run at the same time, causing throttling.
After much research overnight, I found a library developed by Uber that automatically adjusts the GOMAXPROCS variable more efficiently, regardless of whether it is in a container or not. This solution proved to be extremely stable and efficient: automaxprocs
 uber-go
/
automaxprocs
uber-go
/
automaxprocs
Automatically set GOMAXPROCS to match Linux container CPU quota.
automaxprocs 


Automatically set GOMAXPROCS to match Linux container CPU quota.
Installation
go get -u go.uber.org/automaxprocs
Quick Start
import _ "go.uber.org/automaxprocs"

func main() {
  // Your application logic here.
}
Performance
Data measured from Uber's internal load balancer. We ran the load balancer with 200% CPU quota (i.e., 2 cores):
| GOMAXPROCS | RPS | P50 (ms) | P99.9 (ms) |
|---|---|---|---|
| 1 | 28,893.18 | 1.46 | 19.70 |
| 2 (equal to quota) | 44,715.07 | 0.84 | 26.38 |
| 3 | 44,212.93 | 0.66 | 30.07 |
| 4 | 41,071.15 | 0.57 | 42.94 |
| 8 | 33,111.69 | 0.43 | 64.32 |
| Default (24) | 22,191.40 | 0.45 | 76.19 |
When GOMAXPROCS is increased above the CPU quota, we see P50 decrease slightly, but see significant increases to P99. We also see that the total RPS handled also decreases.
When GOMAXPROCS is higher than the CPU quota allocated, we also saw significant throttling:
$ cat /sys/fs/cgroup/cpu,cpuacct/system.slice/[...]/cpu.stat
nr_periods 42227334
nr_throttled 131923
throttled_time 88613212216618
Once GOMAXPROCS was reduced to match the CPU quota, we saw no CPU throttling.
After implementing the use of this library, the problem was resolved, and now the p99 time remained at 0.02 ms constantly. This experience highlighted the importance of observability and profiling in concurrent systems.
The following is a very simple example, but one that demonstrates the difference in performance.
Using Go's native testing and benckmak package, I created two files:
benchmarking_with_enhancement_test.go:
package main
import (
_ "go.uber.org/automaxprocs"
"runtime"
"sync"
"testing"
)
// BenchmarkWithEnhancement Função com melhoria, para adicionar o indice do loop em um array de inteiro
func BenchmarkWithEnhancement(b *testing.B) {
// Obtém o número de CPUs disponíveis
numCPUs := runtime.NumCPU()
// Define o máximo de CPUs para serem usadas pelo programa
maxGoroutines := runtime.GOMAXPROCS(numCPUs)
// Criação do semáforo
semaphore := make(chan struct{}, maxGoroutines)
var (
// Espera para grupo de goroutines finalizar
wg sync.WaitGroup
// Propriade
mu sync.Mutex
// Lista para armazenar inteiros
list []int
)
// Loop com mihão de indices
for i := 0; i
benchmarking_without_enhancement_test.go:
package main
import (
"runtime"
"sync"
"testing"
)
// BenchmarkWithoutEnhancement Função sem a melhoria, para adicionar o indice do loop em um array de inteiro
func BenchmarkWithoutEnhancement(b *testing.B) {
// Obtém o número de CPUs disponíveis
numCPUs := runtime.NumCPU()
// Define o máximo de CPUs para serem usadas pelo programa
maxGoroutines := runtime.GOMAXPROCS(numCPUs)
// Criação do semáforo
semaphore := make(chan struct{}, maxGoroutines)
var (
// Espera para grupo de goroutines finalizar
wg sync.WaitGroup
// Propriade
mu sync.Mutex
// Lista para armazenar inteiros
list []int
)
// Loop com mihão de indices
for i := 0; i
The difference between them is that one uses the Uber library import.
When running the benchmark assuming that 2 CPUs would be used, the result was:
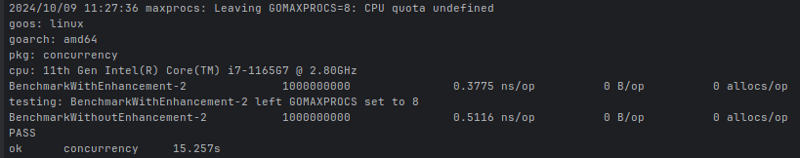
ns/op: Provides an average in nanoseconds of how long it takes to perform a specific operation.
Note that the total available of my CPU is 8 cores, and that is what the runtime.NumCPU() property returned. However, as in running the benchmark, I defined that the use would be only two CPUs, and the file that did not use automaxprocs, defined that the execution limit at a time would be 8 goroutines, while the most efficient would be 2, because this way using less allocation makes execution more efficient.
So, the importance of observability and profiling of our applications is clear.
-
 How Can I UNION Database Tables with Different Numbers of Columns?Combined tables with different columns] Can encounter challenges when trying to merge database tables with different columns. A straightforward way i...Programming Posted on 2025-03-12
 -
How to Sort a 2D Double Array by the First Column in Java?Sorting 2D Arrays Using Java's Arrays.sort()Arrays.sort() is a versatile sorting function in Java that can be utilized for various data types, inc...Programming Posted on 2025-03-12
-
Why Doesn\'t Firefox Display Images Using the CSS `content` Property?Displaying Images with Content URL in FirefoxAn issue has been encountered where certain browsers, specifically Firefox, fail to display images when r...Programming Posted on 2025-03-12
-
Is There a Performance Difference Between Using a For-Each Loop and an Iterator for Collection Traversal in Java?For Each Loop vs. Iterator: Efficiency in Collection TraversalIntroductionWhen traversing a collection in Java, the choice arises between using a for-...Programming Posted on 2025-03-12
-
Why Do C and C++ Promote `short` to `int` During Arithmetic Operations?Why Convert Short to Int for Arithmetic Operations in C and C ?C and C require converting short to int before performing arithmetic operations. Thi...Programming Posted on 2025-03-12
-
Python Read CSV File UnicodeDecodeError Ultimate SolutionUnicode Decode Error in CSV File ReadingWhen attempting to read a CSV file into Python using the built-in csv module, you may encounter an error stati...Programming Posted on 2025-03-12
-
How to Paginate Results with Laravel Eloquent?Pagination Results Using Laravel EloquentLaravel's Eloquent ORM provides a convenient method for querying and retrieving data from your database. ...Programming Posted on 2025-03-12
-
Extending OctoberCMS: Tutorial for creating soft delete plug-inOctoberCMS:插件扩展性深度探索及软删除插件实战 开发者通常青睐易用且可扩展的CMS。OctoberCMS 秉持简洁至上的理念,为开发者和用户带来愉悦的体验。本文将演示OctoberCMS 的一些可扩展特性,并通过一个简单的插件扩展另一个插件的功能。 关键要点 OctoberCMS 提供了...Programming Posted on 2025-03-12
-
How to Access XML Elements with Hyphens in PHP?Accessing XML Elements with Hyphens in PHPIn PHP, when extracting data from XML documents, encountering node names with hyphens may lead to errors. At...Programming Posted on 2025-03-12
-
How to Modify the Encoding of sys.stdout in Python 3?Encoding Output in Python 3: Setting sys.stdout's EncodingIn Python 2, the default output encoding could be effortlessly altered by wrapping sys.s...Programming Posted on 2025-03-12
-
How do you extract a random element from an array in PHP?Random Selection from an ArrayIn PHP, obtaining a random item from an array can be accomplished with ease. Consider the following array:$items = [523,...Programming Posted on 2025-03-12
-
Why Does Microsoft Visual C++ Fail to Correctly Implement Two-Phase Template Instantiation?The Mystery of "Broken" Two-Phase Template Instantiation in Microsoft Visual C Problem Statement:Users commonly express concerns that Micro...Programming Posted on 2025-03-12
-
How Does Constructor Chaining Enhance Object Initialization in C#?C# constructor chain call: efficient and flexible object initialization ] In object-oriented programming, the constructor is responsible for initiali...Programming Posted on 2025-03-12
-
How to upload files with additional parameters using java.net.URLConnection and multipart/form-data encoding?Uploading Files with HTTP RequestsTo upload files to an HTTP server while also submitting additional parameters, java.net.URLConnection and multipart/...Programming Posted on 2025-03-12
-
How to Deserialize JSON Websocket Messages as Union Types in Go?Deserializing JSON Websocket Messages as Union Types in GoIn Go, the gorilla websocket library is commonly used for handling websocket connections. Ho...Programming Posted on 2025-03-12


Study Chinese
- 1 How do you say "walk" in Chinese? 走路 Chinese pronunciation, 走路 Chinese learning
- 2 How do you say "take a plane" in Chinese? 坐飞机 Chinese pronunciation, 坐飞机 Chinese learning
- 3 How do you say "take a train" in Chinese? 坐火车 Chinese pronunciation, 坐火车 Chinese learning
- 4 How do you say "take a bus" in Chinese? 坐车 Chinese pronunciation, 坐车 Chinese learning
- 5 How to say drive in Chinese? 开车 Chinese pronunciation, 开车 Chinese learning
- 6 How do you say swimming in Chinese? 游泳 Chinese pronunciation, 游泳 Chinese learning
- 7 How do you say ride a bicycle in Chinese? 骑自行车 Chinese pronunciation, 骑自行车 Chinese learning
- 8 How do you say hello in Chinese? 你好Chinese pronunciation, 你好Chinese learning
- 9 How do you say thank you in Chinese? 谢谢Chinese pronunciation, 谢谢Chinese learning
- 10 How to say goodbye in Chinese? 再见Chinese pronunciation, 再见Chinese learning


