
Improved &#printf&# debugging
 Browse:208
One of the most common debugging techniques, 'printf' debugging is particularly popular because most people learn it intuitively when writing their first programs.
'printf' debugging is very accessible because you don't need any special tools for it. When you face your first bugs, even before you know what a debugger is, the natural thing to do is to have your program print variables step by step, so you can follow the execution in the console.
Although it is one of the most basic debugging techniques, it is also widely used by experienced developers. It can help you investigate any type of problem, such as suboptimal routines, inconsistent state, multithreading problems, and more.
As I already mentioned, this technique does not require you to use any special tools, such as an IDE. However, if you are using one, it can make you even more efficient at recording program state.
Note: This article shows features of IntelliJ IDEA. Similar features may or may not be available in other IDEs. If you are using a different tool, consider checking its documentation to see if these features are also present.
live templates
IntelliJ IDEA provides live templates for the most common debug logging patterns. To use a live template for debug logging, enter the corresponding abbreviation and press Tab. IntelliJ IDEA will generate the print statement and insert it into the cursor.
Let's look at a couple of examples.
Register method parameters
public static BufferedImage recolor(BufferedImage in, BufferedImage mask, int newColor) {

    // escriba 'soutp' aquí, luego presione Tab

    return null;
}
Generated code:
public static BufferedImage recolor(BufferedImage in, BufferedImage mask, int newColor) {

    System.out.println("in = "   in   ", mask = "   mask   ", newColor = "   newColor);

    return null;
}
Register values
public static double coolMethod(double parameter) {
    double a = Math.random();
    double b = Math.random();

    // escriba 'soutv' aquí, presione Tab y luego seleccione el valor

    return a * b * parameter;
}
Generated code:
public static double coolMethod(double parameter) {
    double a = Math.random();
    double b = Math.random();

    System.out.println("b = "   b);

    return a * b * parameter;
}
Register method entries
public static BufferedImage recolor(BufferedImage in, BufferedImage mask, int newColor) {

    // escriba 'soutm' aquí

    return null;
}
Generated code:
public static BufferedImage recolor(BufferedImage in, BufferedImage mask, int newColor) {

    System.out.println("ImageUtils.recolor");

    return null;
}
Logging breakpoints
One of the disadvantages of debugging with print statements is that they introduce the overhead of manual management. You can't turn them on and off quickly, and you definitely don't want to make the mistake of shipping and running them in production.
For this reason, if you need to log something for debugging purposes, I would recommend using logging breakpoints, as they are much easier to handle.
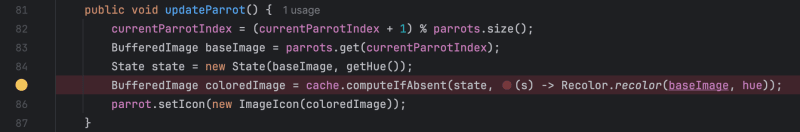
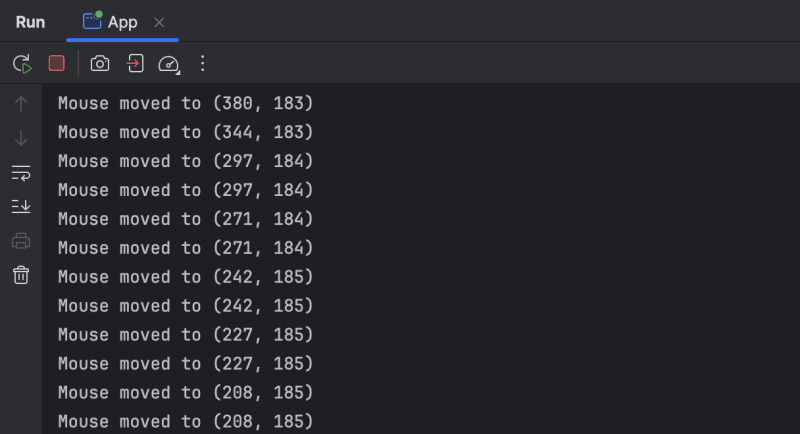
To set a logging breakpoint, hold Shift, then click in the margin. Unlike a regular breakpoint, it does not suspend program execution, but instead prints to the console.
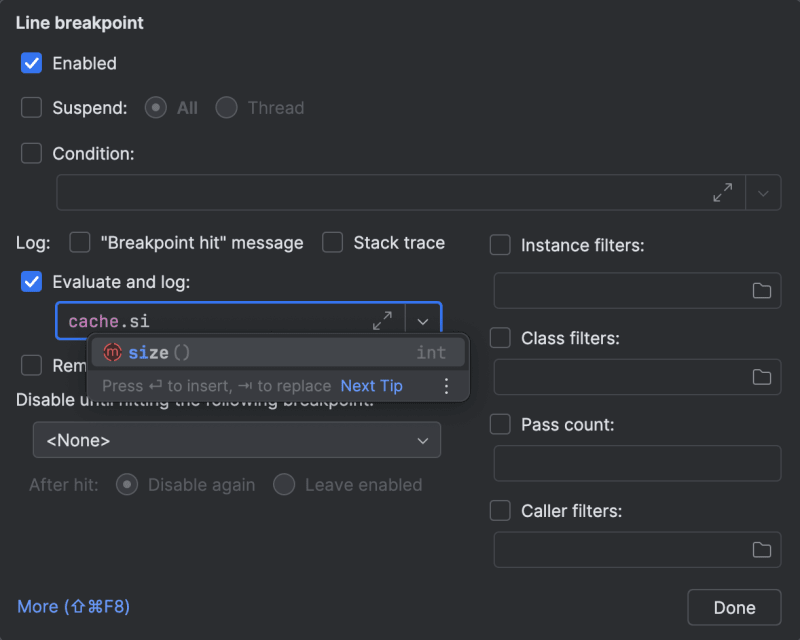
By default, this is a message indicating that the program has reached this line. You can also use the options near the Evaluate and log checkbox in the breakpoint settings if you prefer to log the current stack trace or the result of a custom expression.
Note: Be careful with logging expressions. Evaluating those that cause side effects can be a source of new bugs or unexpected behavior. Additionally, when used in hot code, they could significantly slow down your program.
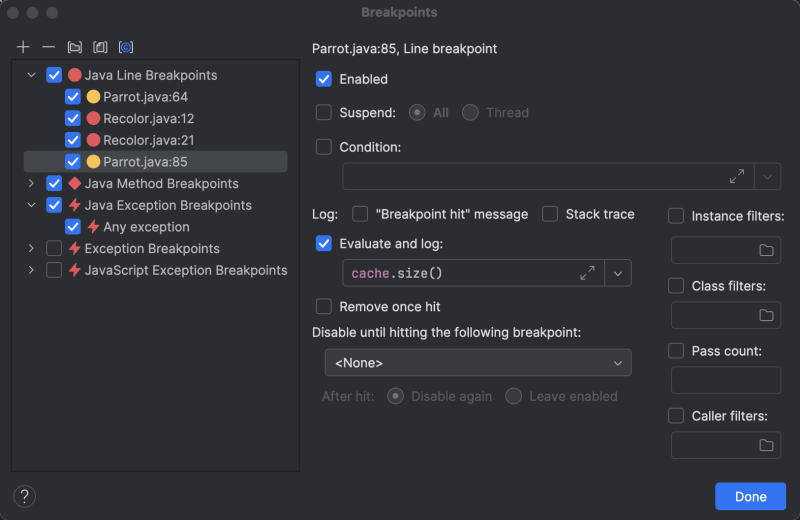
When log breakpoints become numerous, you can track and manage them in the Breakpoints dialog box (Run | View Breakpoints ):
You can even create custom groups for them:
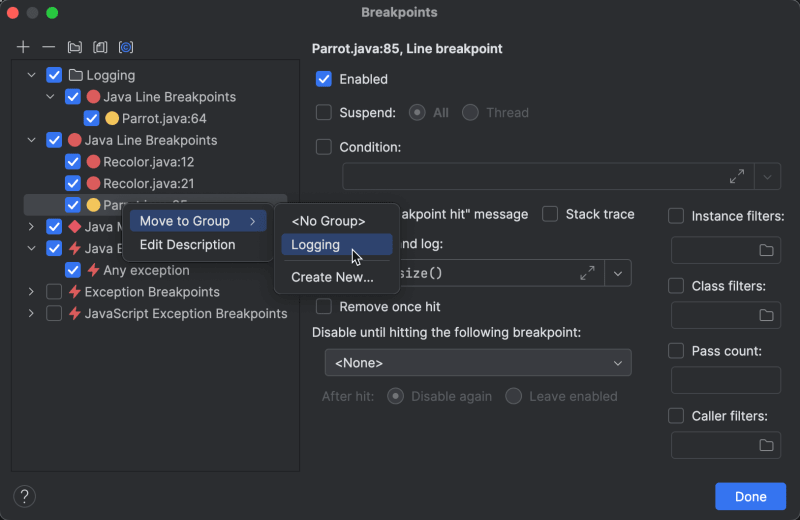
This will help you manage your breakpoints centrally. For example, you can create a group related to a particular bug and save it for later. When the problem disappears, you simply turn it off. This way, if the problem appears again, you don't have to recreate everything from scratch. You simply turn the group back on.
Frequent Event Log
For events that occur a lot during program execution, logging each event individually may be superfluous. Not only does this flood the console with messages, but a lot of I/O interaction can significantly slow down the debugging session.
For these events, it may be useful to use the Pass count function. You can access it in the Breakpoints.
dialog box.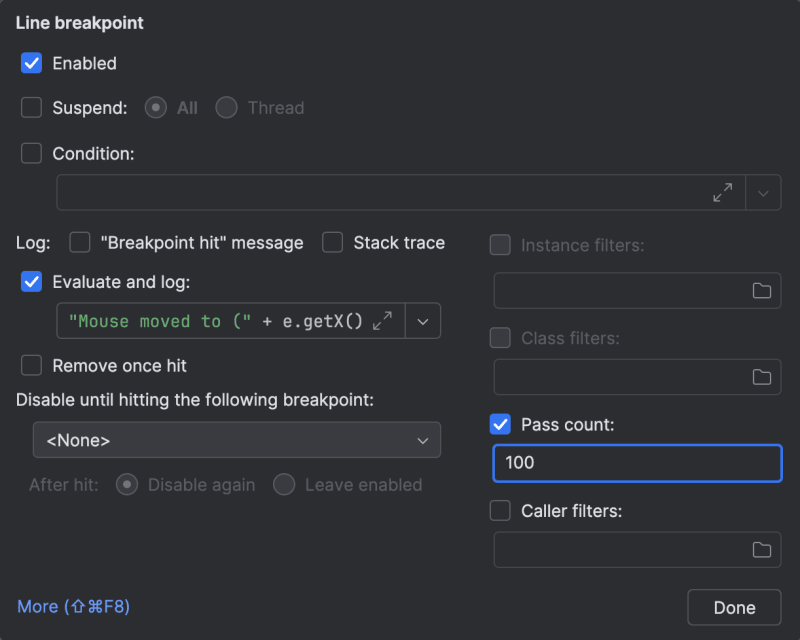
After you have set Pass count to a specific value, the corresponding breakpoint will only be triggered each time it is reached n-times, ensuring that logging does not become a nuisance.
Summary
Whether you're inserting print statements or setting logging breakpoints for debugging, modern tools have features to improve your debugging experience. With this post, I wanted to make sure you are aware of these little tricks that make the whole process more enjoyable.
If you are interested in more articles related to debugging and profiling, check out some of my other articles:
- Debugger.godMode() – Hack a JVM Application with the Debugger
- Troubleshoot Slow Debugger
- What's Wrong with createDirectories()? - Guide to CPU Profiling
- Debug without Breakpoints
-
 How to Efficiently Convert Timezones in PHP?Efficient Timezone Conversion in PHPIn PHP, handling timezones can be a straightforward task. This guide will provide an easy-to-implement method for ...Programming Posted on 2025-04-18
 -
FastAPI Custom 404 Page Creation GuideCustom 404 Not Found Page with FastAPITo create a custom 404 Not Found page, FastAPI offers several approaches. The appropriate method depends on your...Programming Posted on 2025-04-18
-
How Can I Maintain Custom JTable Cell Rendering After Cell Editing?Maintaining JTable Cell Rendering After Cell EditIn a JTable, implementing custom cell rendering and editing capabilities can enhance the user experie...Programming Posted on 2025-04-18
-
How to Correctly Use LIKE Queries with PDO Parameters?Using LIKE Queries in PDOWhen trying to implement LIKE queries in PDO, you may encounter issues like the one described in the query below:$query = &qu...Programming Posted on 2025-04-18
-
Is There a Performance Difference Between Using a For-Each Loop and an Iterator for Collection Traversal in Java?For Each Loop vs. Iterator: Efficiency in Collection TraversalIntroductionWhen traversing a collection in Java, the choice arises between using a for-...Programming Posted on 2025-04-18
-
JavaScript replace method removes text in stringExtracting Text from Strings: Removing Unwanted PrefixesIn the realm of programming, manipulating strings is often a necessary task. To effectively ma...Programming Posted on 2025-04-18
-
How to Resolve \"Refused to Load Script...\" Errors Due to Android\'s Content Security Policy?Unveiling the Mystery: Content Security Policy Directive ErrorsEncountering the enigmatic error "Refused to load the script..." when deployi...Programming Posted on 2025-04-18
-
How Can I Configure Pytesseract for Single Digit Recognition with Number-Only Output?Pytesseract OCR with Single Digit Recognition and Number-Only ConstraintsIn the context of Pytesseract, configuring Tesseract to recognize single digi...Programming Posted on 2025-04-18
-
The difference between PHP and C++ function overload processingPHP Function Overloading: Unraveling the Enigma from a C PerspectiveAs a seasoned C developer venturing into the realm of PHP, you may encounter t...Programming Posted on 2025-04-18
-
Why Does PHP's DateTime::modify('+1 month') Produce Unexpected Results?Modifying Months with PHP DateTime: Uncovering the Intended BehaviorWhen working with PHP's DateTime class, adding or subtracting months may not a...Programming Posted on 2025-04-18
-
When to use "try" instead of "if" to detect variable values in Python?Using "try" vs. "if" to Test Variable Value in PythonIn Python, there are situations where you may need to check if a variable has...Programming Posted on 2025-04-18
-
How to Correctly Display the Current Date and Time in "dd/MM/yyyy HH:mm:ss.SS" Format in Java?How to Display Current Date and Time in "dd/MM/yyyy HH:mm:ss.SS" FormatIn the provided Java code, the issue with displaying the date and tim...Programming Posted on 2025-04-18
-
`console.log` shows the reason for the modified object value exceptionObjects and Console.log: An Oddity UnraveledWhen working with objects and console.log, you may encounter peculiar behavior. Let's unravel this mys...Programming Posted on 2025-04-18
-
How Can I Customize Compilation Optimizations in the Go Compiler?Customizing Compilation Optimizations in Go CompilerThe default compilation process in Go follows a specific optimization strategy. However, users may...Programming Posted on 2025-04-18
-
Call Python function from C/C++ and get the return value methodExtracting Return Value from a Python Function Called in C/C Calling a custom Python function from C/C allows for extended functionality, but extra...Programming Posted on 2025-04-18


Study Chinese
- 1 How do you say "walk" in Chinese? 走路 Chinese pronunciation, 走路 Chinese learning
- 2 How do you say "take a plane" in Chinese? 坐飞机 Chinese pronunciation, 坐飞机 Chinese learning
- 3 How do you say "take a train" in Chinese? 坐火车 Chinese pronunciation, 坐火车 Chinese learning
- 4 How do you say "take a bus" in Chinese? 坐车 Chinese pronunciation, 坐车 Chinese learning
- 5 How to say drive in Chinese? 开车 Chinese pronunciation, 开车 Chinese learning
- 6 How do you say swimming in Chinese? 游泳 Chinese pronunciation, 游泳 Chinese learning
- 7 How do you say ride a bicycle in Chinese? 骑自行车 Chinese pronunciation, 骑自行车 Chinese learning
- 8 How do you say hello in Chinese? 你好Chinese pronunciation, 你好Chinese learning
- 9 How do you say thank you in Chinese? 谢谢Chinese pronunciation, 谢谢Chinese learning
- 10 How to say goodbye in Chinese? 再见Chinese pronunciation, 再见Chinese learning


