How CheckStat was created: Real-time site analytics
What is CheckStat
CheckStat is a project I developed to help website owners, developers, and analysts better understand what's happening on their web resources. This tool lets you track what your visitors are doing on your site in real-time. Analyzing these stats helps you make more informed decisions and improve your website's performance.
1. Activity
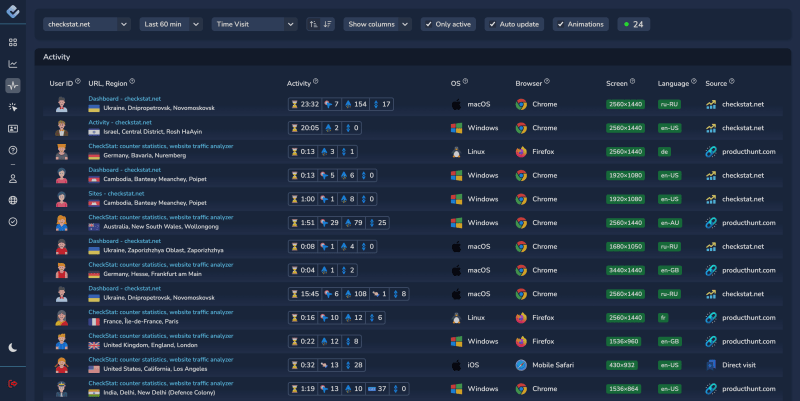
In the "Activity" section, you can watch what your visitors are doing on your site in real-time. This gives you a complete picture of who is on your site right now, what they're doing, and where they came from.

- Unique icons for each visitor: Every user on your site is represented by a unique icon, making it easier to identify them. You can customize the icon for each visitor, selecting and locking a specific image.
- Visit time information: The time when a visitor entered your site is displayed according to your time zone, which helps sync data with local events or promotions on the site.
- Visit count: The system shows how many times a user has visited the site today, this month, and overall, helping you gauge the loyalty and activity of your regular visitors.
- URL and page title: For each visit, the URL and title of the page they are viewing are displayed, helping you understand what content is capturing users' attention.
- Geolocation: You can see the country, region, and city from which the visitor came. This is important for analyzing the geographic distribution of your audience.
- User activity: Parameters such as clicks, mouse movements, keystrokes, sensor interactions, and scrolling are tracked, giving you a full understanding of the user's engagement with your site.
- Technical details: The system provides information about the user's operating system, browser, device type, and screen resolution. This data helps in optimizing content and design for different devices.
- Traffic source: You can see where the visitor came from (e.g., search engines, social networks, or other websites), helping you assess the effectiveness of your marketing campaigns.
Additionally, in the "Activity" section, you can activate filters to display only active users who are engaging with the site. This allows you to focus on the users who are most involved with your content.
Auto-refresh is enabled by default, and new visits are displayed in real-time with animation. This feature helps you react instantly to changes on the site, such as during a promotion or marketing campaign.
2. Statistics
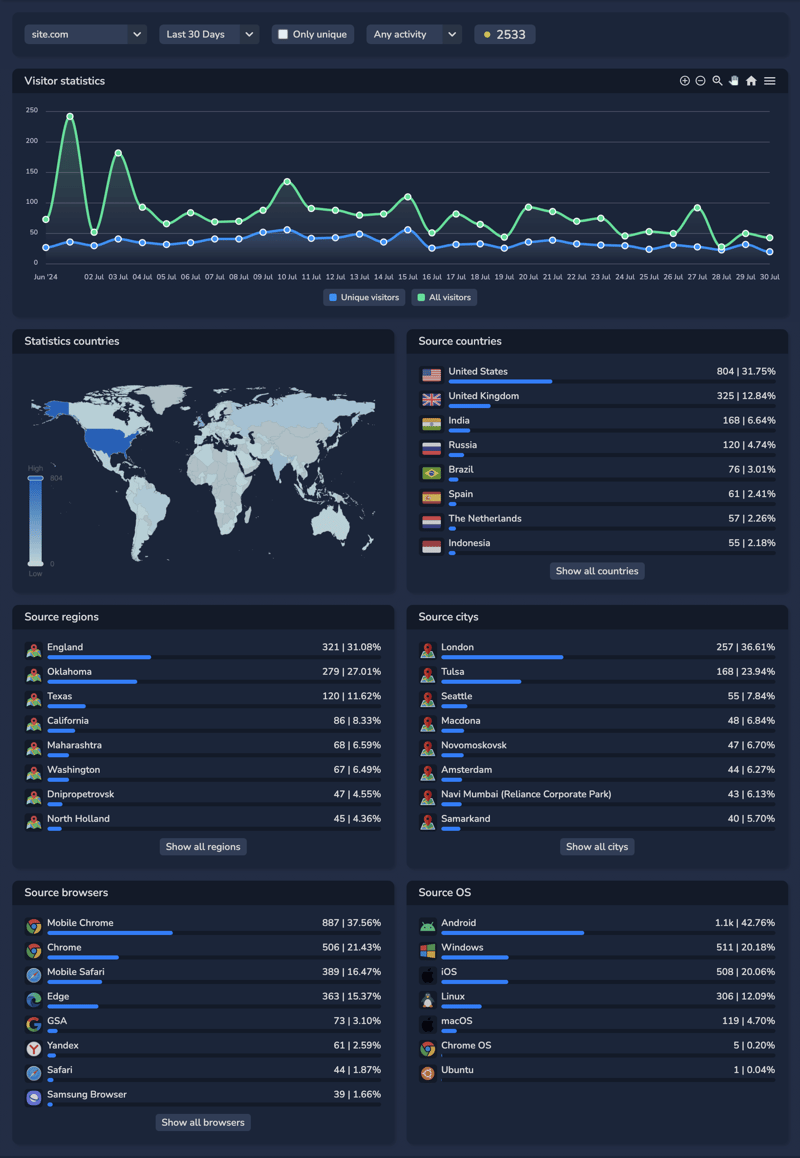
The "Statistics" section is designed for deeper analytics. Here, you can collect and analyze data over any period, not limited to standard time intervals.

- Main chart: The main chart displays two lines — the total number of views and unique visitors over the selected time period. This helps you quickly assess how site activity has changed over days, weeks, or months.
- Visitor map: The world map visualizes visitor data from different countries. The color gradient from white (minimum visitors) to blue (maximum visitors) makes it easy to see which regions bring in the most traffic.
- Parameter analytics: At the bottom of the page, blocks display data by country, region, city, browser, operating system, and other parameters. You can select the parameters you're interested in and add them to a filter to see only the information you need. This flexible tool helps you refine your analysis and make more accurate decisions.
You can also set up filters to include or exclude certain parameters and see how this affects overall statistics. For example, you can see how users from a specific region interact with your site and which pages attract them the most.
3. Dashboard
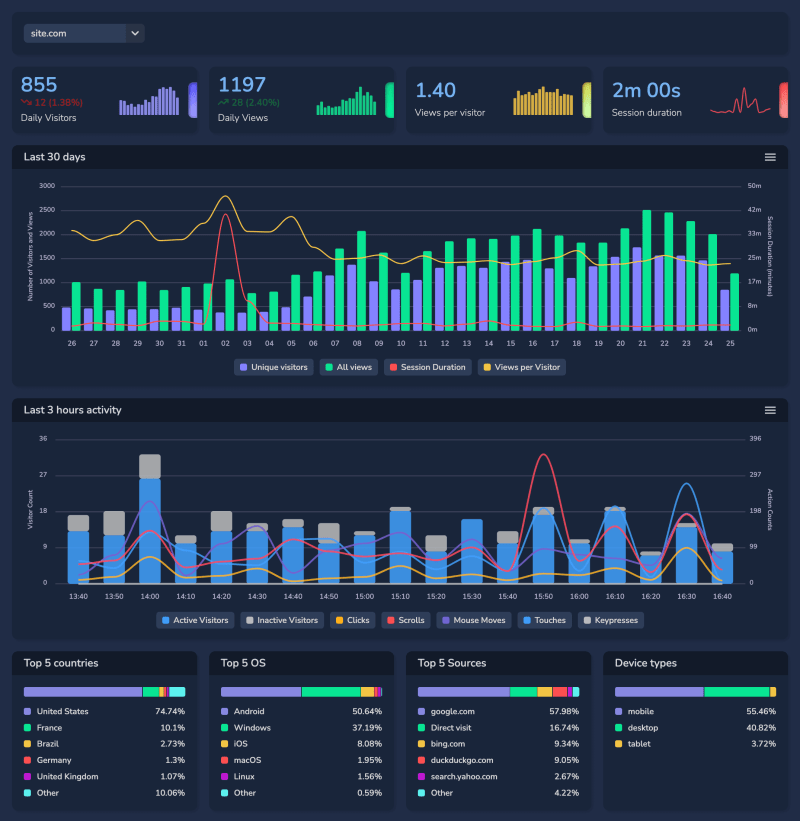
The "Dashboard" is a summary panel that displays your site's key metrics for the current day and tracks changes over the last 30 days.

- Key metrics: The panel shows the number of unique visitors, total views, average views per visitor, and average session duration. This data helps you quickly assess your site's current performance.
- Activity charts: On the dashboard, you can see charts showing user activity over the last three hours, grouped in 10-minute intervals. This helps you assess peak activity periods and determine when your site is most visited.
- Top 5 key parameters: Here, you’ll find data on the top 5 countries, operating systems, traffic sources, and device types. This data helps you understand what devices and platforms your users are using and where they are coming from.
The "Dashboard" is a place where you can quickly get an overall picture of what's happening on your site.
Technical Details
CheckStat is built using modern technologies that ensure high performance and scalability:
- PHP: The main language used for server-side development and application logic processing.
- MySQL and Elasticsearch: MySQL is used for reliable data storage, while Elasticsearch enables fast search and analysis of large volumes of information.
- Kibana: A tool for real-time data visualization, integrated with Elasticsearch.
- Nginx: A web server that provides fast and stable access to the site.
- JavaScript and AJAX: Used to create dynamic and interactive elements on the client side.
- UAParser.js and current-device: Libraries for identifying the device and its characteristics.
- ApexCharts and ECharts: Tools for creating charts and graphs used for data visualization.
- vanilla-datetimerange-picker: A library for easy date range selection, making analytics on the user side more convenient.
These technologies help CheckStat quickly process large amounts of data and provide real-time analytics.
Use Cases
CheckStat is a tool that really helps improve your website. Here’s how you can use it:
- Monitor user actions: In the "Activity" section, you can see in real-time what your visitors are doing on your site. Who came in, what pages they are viewing, where they came from, what devices and browsers they are using — it's all right there. This is useful to understand how people interact with your content and where they might lose interest.
- Filter and analyze data: In "Statistics," you can set up filters to see only the information you need. For example, you can choose data by specific regions or traffic sources and exclude the unnecessary. This helps you focus on what really matters.
- Optimize content: Using data from "Activity" and "Statistics," you can identify which pages are popular and improve them. If you see that people spend a lot of time on certain pages, it might be worth adding more useful content to them.
- Analyze traffic sources: CheckStat shows where your visitors are coming from — whether it's search engines, social networks, or direct entries. This helps you understand which channels are working best and where to invest more effort.
These examples show how CheckStat can help you understand what’s happening on your site and make it better.
About the Developer
CheckStat was developed in Ukraine, under challenging conditions of ongoing war and periodic power outages due to damage to the energy infrastructure. Despite these challenges, the project was successfully completed and continues to evolve.
Conclusion
CheckStat is a tool designed for those who want to better understand their users and make their website better. It allows you to easily track site activity, analyze key metrics, and make data-driven decisions. Try CheckStat and see for yourself how convenient and useful it can be.
Site Link: CheckStat.net
-
 How do I combine two associative arrays in PHP while preserving unique IDs and handling duplicate names?Combining Associative Arrays in PHPIn PHP, combining two associative arrays into a single array is a common task. Consider the following request:Descr...Programming Published on 2024-11-18
 -
 Using WebSockets in Go for Real-Time CommunicationBuilding apps that require real-time updates—like chat applications, live notifications, or collaborative tools—requires a communication method faster...Programming Published on 2024-11-18
 -
 How Can I Find Users with Today\'s Birthdays Using MySQL?How to Identify Users with Today's Birthdays Using MySQLDetermining if today is a user's birthday using MySQL involves finding all rows where ...Programming Published on 2024-11-18
 -
 How to Fix \"ImproperlyConfigured: Error loading MySQLdb module\" in Django on macOS?MySQL Improperly Configured: The Problem with Relative PathsWhen running python manage.py runserver in Django, you may encounter the following error:I...Programming Published on 2024-11-18
 -
 Beyond `if` Statements: Where Else Can a Type with an Explicit `bool` Conversion Be Used Without Casting?Contextual Conversion to bool Allowed Without a CastYour class defines an explicit conversion to bool, enabling you to use its instance 't' di...Programming Published on 2024-11-18
 -
 How to Send FormData and String Data Simultaneously in JQuery AJAX?Sending FormData and String Data Simultaneously in JQuery AJAXWhen working with forms involving file uploads, it is necessary to combine file data wit...Programming Published on 2024-11-18
 -
 Why Are Pointers Used for the http.Request Type in Go?Understanding the Pointer Requirement in http.RequestIn the Go programming language, pointers are essential for handling large structures efficiently....Programming Published on 2024-11-18
 -
 How to Connect to a TCP Socket from a Browser Using JavaScript in Chrome\'s Experimental Feature?Connecting to TCP Socket from Browser Using JavaScriptWhile you seek to establish a two-way communication between a browser's JavaScript and a TCP...Programming Published on 2024-11-18
 -
 How to Return an Error if a Go Function Panics?Returning from Defer in GoYou're encountering an issue where you want to return an error if a function panics in Go. Here's an analysis and a ...Programming Published on 2024-11-18
 -
 What Happened to Column Offsetting in Bootstrap 4 Beta?Bootstrap 4 Beta: The Removal and Restoration of Column OffsettingBootstrap 4, in its Beta 1 release, introduced significant changes to the way column...Programming Published on 2024-11-17
 -
 How to Debug Python Code Effectively: Practical Tips and ToolsPython Debugging: Practical Tips and ToolsWhen troubleshooting Python code, it's crucial to have a toolkit of debugging techniques at your disposa...Programming Published on 2024-11-17
 -
 How can I clear the MySQL query cache without restarting the server?Mitigating the MySQL Query Cache without Resuming the ServerDespite the increased performance offered by the MySQL query cache, occasions may arise wh...Programming Published on 2024-11-17
 -
 How Does MySQL Handle Case Sensitivity in Table and Column Names?Case Sensitivity of Column and Table Names in MySQLThe topic of case sensitivity in MySQL can be a source of confusion for many users. Understanding t...Programming Published on 2024-11-17
 -
 Why Does Binding a Const Reference to a Temporary Object Extend Its Lifetime?Why Does Binding a Const Reference to a Temporary Prolong the Temporary's Lifetime?The C programming language allows const references to extend ...Programming Published on 2024-11-17
 -
 How to Host a Laravel Project in a Subdirectory on Shared Hosting without Exposing `/public` in the URLWhen hosting a Laravel project on shared hosting, one common challenge is ensuring that URLs don't require the /public directory. Here’s a step-by...Programming Published on 2024-11-17
Study Chinese
- 1 How do you say "walk" in Chinese? 走路 Chinese pronunciation, 走路 Chinese learning
- 2 How do you say "take a plane" in Chinese? 坐飞机 Chinese pronunciation, 坐飞机 Chinese learning
- 3 How do you say "take a train" in Chinese? 坐火车 Chinese pronunciation, 坐火车 Chinese learning
- 4 How do you say "take a bus" in Chinese? 坐车 Chinese pronunciation, 坐车 Chinese learning
- 5 How to say drive in Chinese? 开车 Chinese pronunciation, 开车 Chinese learning
- 6 How do you say swimming in Chinese? 游泳 Chinese pronunciation, 游泳 Chinese learning
- 7 How do you say ride a bicycle in Chinese? 骑自行车 Chinese pronunciation, 骑自行车 Chinese learning
- 8 How do you say hello in Chinese? 你好Chinese pronunciation, 你好Chinese learning
- 9 How do you say thank you in Chinese? 谢谢Chinese pronunciation, 谢谢Chinese learning
- 10 How to say goodbye in Chinese? 再见Chinese pronunciation, 再见Chinese learning


